Business Intelligence for the Financial Industry
Streamline and optimize business processes. Predict and capitalize on trends with embedded business intelligence for finance.
Embedded BI for Finance Teams
Embedded business intelligence for the financial industry provides a roadmap for you to see the larger picture or more granular details, allowing you to concentrate on asking the right questions.
Empower Teams with Data Insights
Instant access to KPIs allows everyone to uncover market volatility and track market trends.
Secured Data with Role-based Permissions
Securely share reports and dashboards across the team with a BI platform with built-in end-to-end security.
Embedded BI to Grow with Your Business
Simple licensing allows you to lower and maintain BI costs, even as you scale up in users and data.

Benefits of Finance BI
Evaluate your financial health with a unified embedded BI platform.
- Predict and capitalize on trends
- Increases profitability
- Reduces risk exposure
- Eliminates data silos
- Enhances collaboration
- Improves insight into consumer behavior
- Reduces risks
Visualizing Your Finance BI with Dashboards
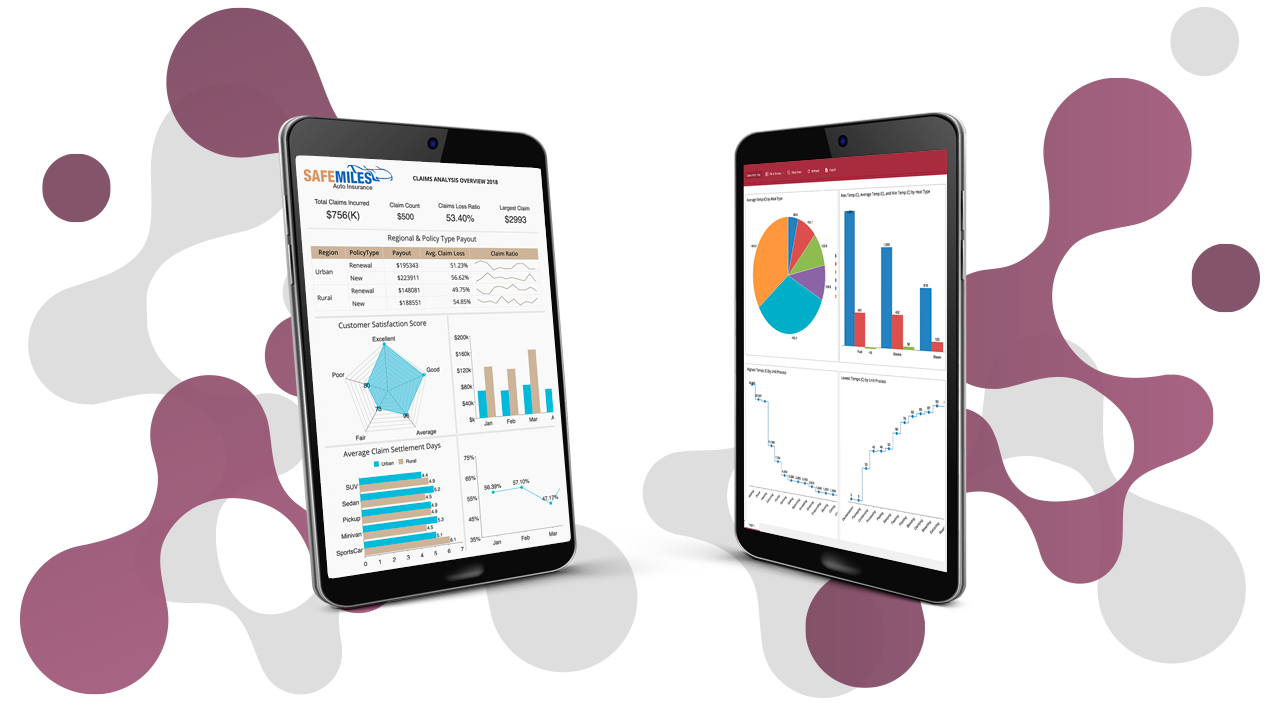
Here, we'll look at dynamic and interactive financial dashboards that any end-user can create in minutes.
Financial Risk Management
Analyze trading risks, plan budgets, assess portfolios, and audit your organization for regulatory purposes.
Financial Comparisons Dashboards
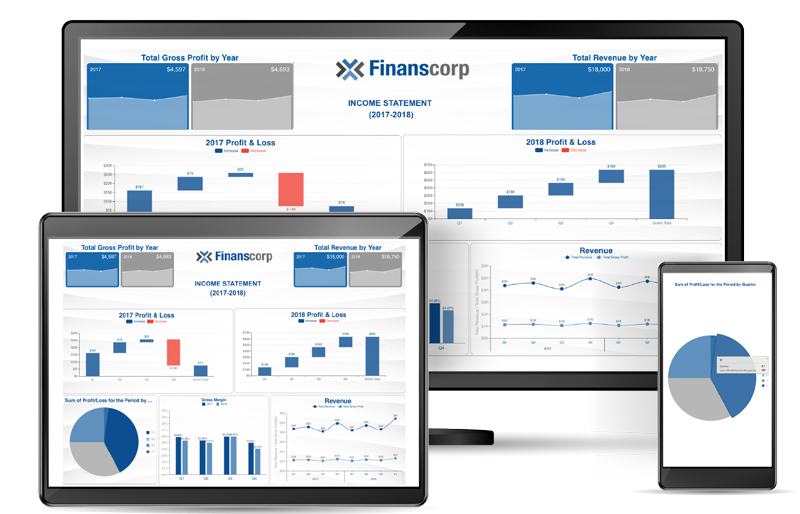
Visualize year-over-year comparisons, find financial trends and growth patterns.
Track Profit and Loss with a CFO BI Dashboard
Gain a real-time, consistent, and accurate view of financial data with a CFO dashboard.
Profit and Loss Analysis
Estimate budget vs actuals, general ledger account statements, balance sheets, and annual earnings reports.
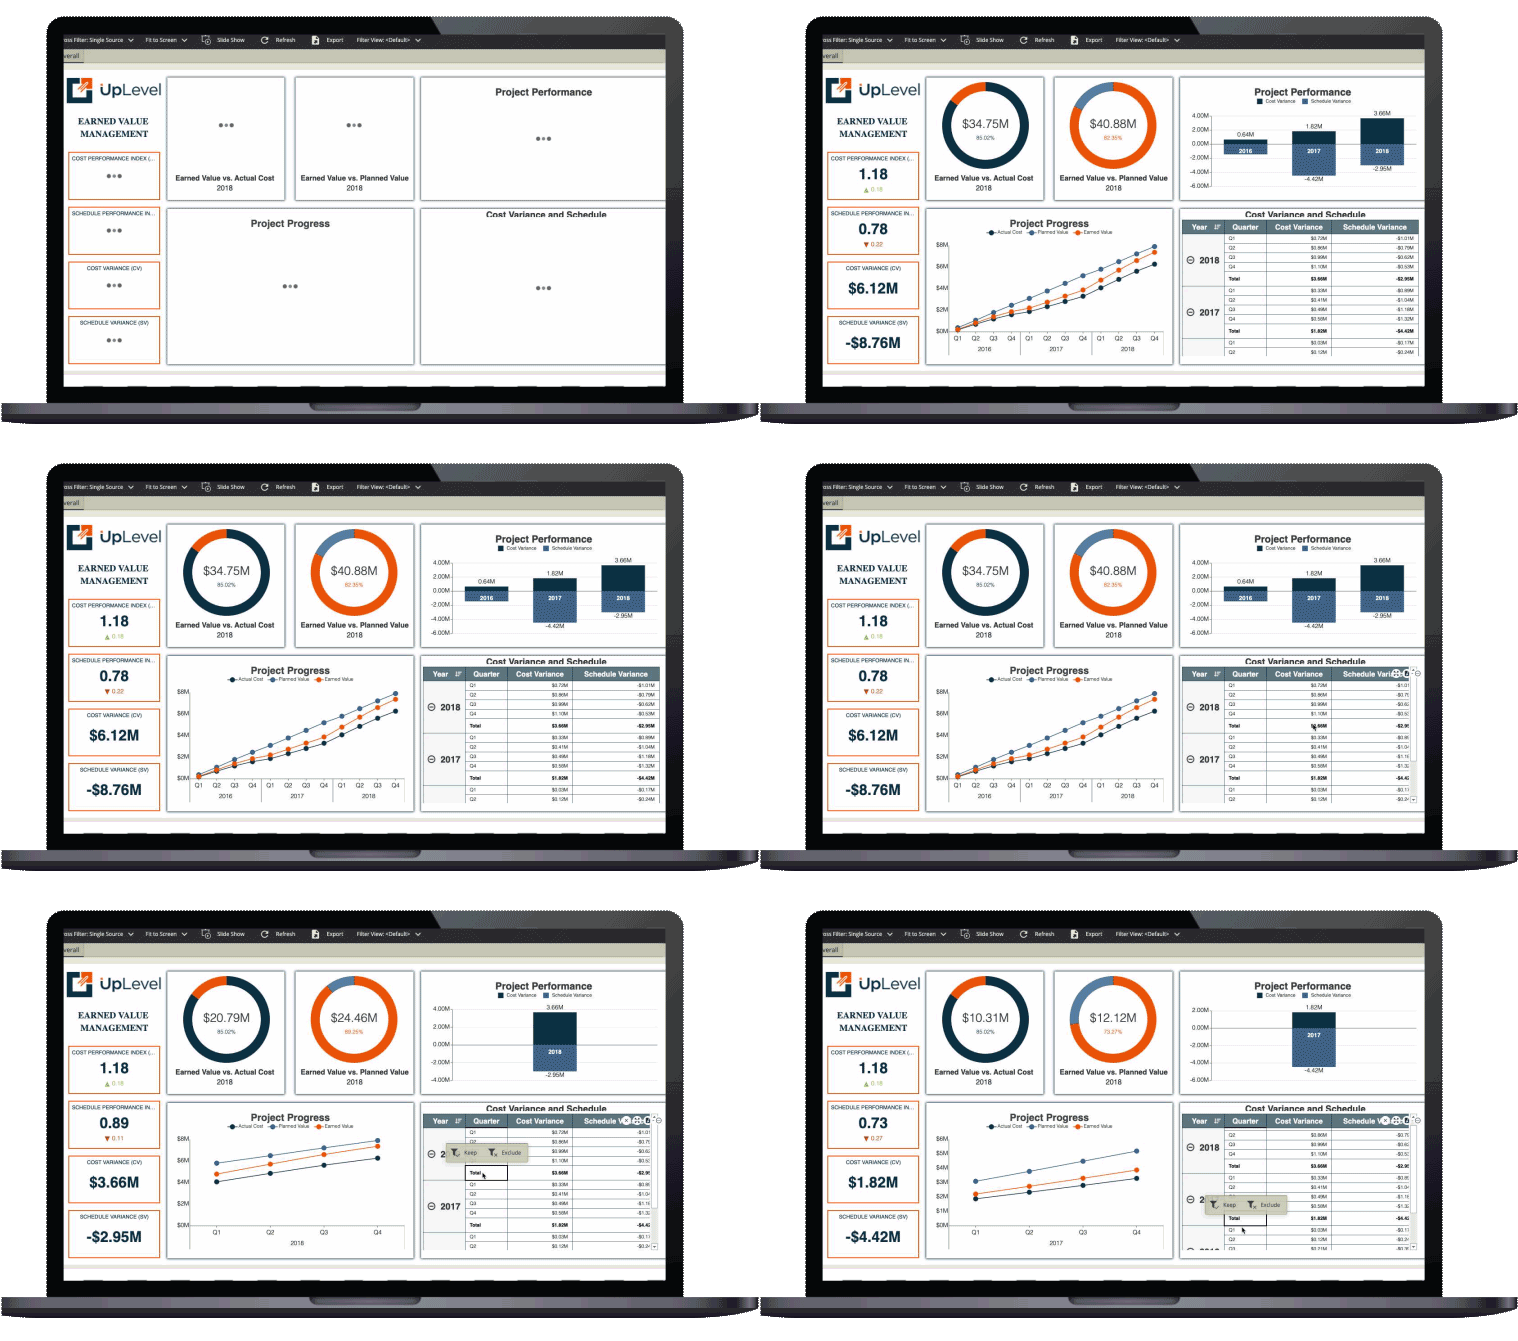
Performance KPIs and Scorecards
Visualize your profitability, value management, COGS, profit margins, credit, collections, and more.
Finance Dashboards
With financial comparison dashboards, users can find financial trends and growth patterns and uncover market volatility.
- Create self-service dashboards and reports.
- Intuitively create ad hoc visualizations and reports with drill-down and cross-filter functionality.
- Use Wyn's Calc Charts to derive ad hoc calculated KPIs from aggregate data.

Powerful BI Reporting Module
Find economic trends, growth patterns, and uncover market volatility.
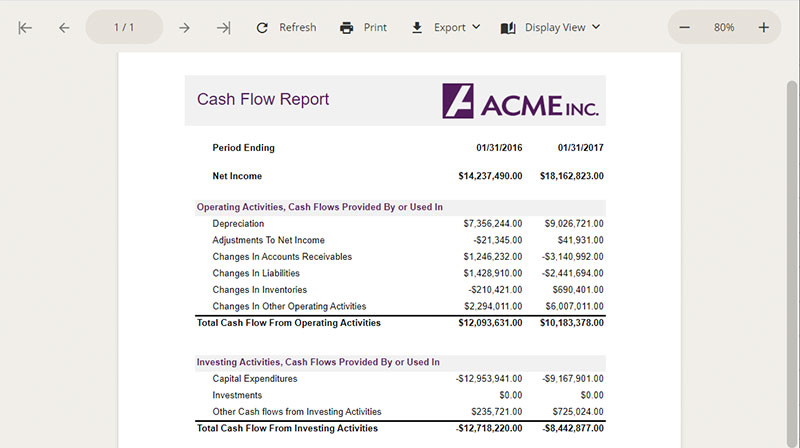
Ideal for self-service reporting, create customized reports with a drag-and-drop user interface. Automated distribution
- Ad hoc reporting
- Pixel-perfect print outputs
Embedded BI to Grow with Your Business
Save BI costs and maintain your budget as your business grows.
Wyn's simple, transparent licensing allows room for business growth. Embed Wyn Enterprise in an unlimited number of applications with an unlimited number of end-users, for a flat fee.
- No per-user fees
- No data limitations

See What our Customers are Saying:


