In an earlier article, we talked about hosting Wyn Enterprise in a web application with the help of an iFrame.
In this article, we will go one step further into the embeddable BI capabilities. We'll look at integrating Wyn Enterprise to provide embedded BI to end-users. To achieve this, we will use a React application with the help of Wyn's API endpoints.
Before we dive into the article, let us take a step back and look at what embedded BI is and why has it become essential in today's applications.
Data Insights from Embedded BI
Before embedded BI was popular, analytics tools were required to get insights from data, but such tools were separate from existing business processes for end-users. This forced end-users to switch between typical day-to-day business applications and an external analytics tool.
This partition between business processes and analytics decreased efficiency, increased time to value, and was frustrating throughout the entire organization.
Embedded BI resolves this issue entirely, as it provides an integration of business intelligence tools within a business application for enhanced user experience. Embedded BI provides capabilities such as Reporting, Dashboards, Data Visualizations, and Analysis all together in a single business application so there's no need to navigate to a separate Analytics/BI tool.
Embedded BI with Wyn
Wyn Enterprise is a business intelligence software that delivers collaborative self-service reporting & analytics, data visualization, and data moderation. Wyn Enterprise uses GraphQL as the query language to call its API endpoints and return the requested data.
This article assumes you already have a pre-existing React application. If not, you can run the following npm commands to get set up quickly:
npx create-react-app my-app
cd my-app
npm start
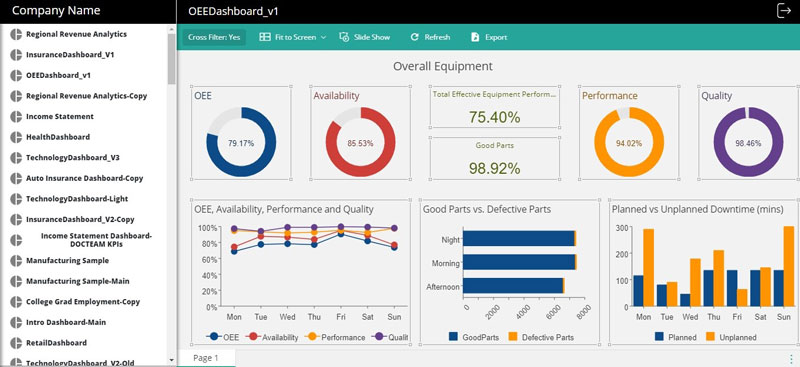
Here is a look at how the application will look at the end of this article:

This is the list of Wyn API functions we will cover in this article:
1. Authentication
2. Get Reports List
3. Get Report Info
4. View Report
5. Export Report
6. Get Dashboards List
7. Get Dashboard Info
8. View Dashboard
1. Authentication
Every secure application requires authentication, including Wyn Enterprise. The authentication process in Wyn is simple and straightforward. The authentication endpoint requires a username, password, clientid, and a clientsecret.
The username and password are the same that you use to login to the Wyn portal. The client_id is 'integration' by default unless you've changed it in the configuration.
To obtain the clientsecret, you can access the URL '{serverUrl}/management#client-management' and get the clientsecret corresponding to the 'integration' client_id.
You must be logged in as the admin to access the above URL (you might have to edit the client to view the complete client_secret).
These are all a part of the request's body and the endpoint returns an access token which is then used in all subsequent API calls to ensure the required permissions are granted.
API Call:
Example Request:
Example Response:
2. Get Reports List
Once the authentication is successful, the next step would be to show a list of documents that are stored on your Wyn server that the user can select from. Let's look at the API endpoint to show a list of all the reports that exist on the Wyn server.
The call to the server is made using a GraphQL query along with the access token that was fetched through the Authentication API endpoint.
GraphQL query:
The ‘key’ attribute is what determines the type of document that will be returned as part of the response and the ‘documents’ array determines the list of fields to be returned with their values.
For reports, the 'key' attribute's value is 'rdl'. There are other keys e.g. dbd (for dashboards), dsc (for datasource), dataset (for dataset), etc, which will be discussed later in this article or in a subsequent article. Additional fields can be added to the 'documents' array if required, e.g. created, created_by, modified, modified_by, effective_ops, etc. See below for information on the GraphQL documentation.
API call:
Example Request:
Example Request:
3. Get Report Info
Now that we have a list of all the reports, we want to select a report to view it within the application. Before we view the report, the report may require some parameters. This is where the 'reportInfo' API endpoint comes in handy. The reportInfo API endpoint returns a list of parameters (if any) and their default values based on the report's Id, hence making it easy for us to send the values of the parameter(s) for subsequent queries. Only the report Id and the access token are required as part of the GraphQL query.
GraphQL query:
API Call:
Example Request:
Example Response:
4. View Report
Now we'll view the report in our application. We will use an iFrame for the purpose of displaying the report within our application. The API call to view a report is a three-step process.
The first step is to call the 'render' endpoint with the selected report Id. This call runs the report on the server and returns a job Id.
The second step is to use this job Id to call the 'job' API endpoint which returns the status of the document and the document ID once it has been rendered on the server. Finally, the document Id is used to call the 'exportDocument' endpoint to get the exported document's URL which in turn is set as the source of iFrame and displayed to the user.
The 'exportDocument' endpoint is explained later in this article.
GraphQL query:
API Call:
Example Request:
Example Response:
1. Job ID
1. Job ID
2. Document ID
3. Document URL
The 'resultUrl' is what will be used as the source of the iFrame. The type of the exported document is determined by the 'exportExtension' argument passed to the 'exportDocument' endpoint. The 'verificationUrl' can be optionally used for checking export errors after reading result stream.
Direct URL
There's another approach to display the report in an iFrame. This alternate approach is to set the source of the iFrame to the following URL with the required report ID and the access token.
5. Export Report
In any business application, especially those with BI and analytical tools, it is important to provide export functionality for further analysis and to share with stakeholders and colleagues. Once the report has been displayed, you can export it to the desired format using the 'exportReport' API endpoint.
Wyn's API provides the capability to export reports to the following formats:
- Excel
- Image
- HTML
- CSV
- JSON
- DOCX
The exportReport endpoint returns a URL to the exported document, which is then opened in a new window to be downloaded.
GraphQL query:
The endpoint requires the reportId, the export format (Excel and PDF) and a renderPayload. The renderPayload is an array of {key, value} pairs which contain the report parameters as keys with their corresponding value(s) for parameterized reports.
API Call:
Example Request:
Example Response
6. Get Dashboards List
Moving on from reports, let's take a look at dashboards. Dashboards have become quintessential in embedded BI and business applications. They provide an at-a-glance view of key performance indicators (KPIs) and help track and analyze various aspects of a business with the help of data visualizations, such as charts, gauges, matrices, and tables.
In Wyn Enterprise, we can get a list of all Dashboards using the same API endpoint as Reports ('documentTypes'), except the 'key' attribute in this case would be 'dbd', instead of 'rdl'. This specifies that we should return documents with extension 'dbd.'
This will return an array of all Dashboards existing on the Wyn server.
GraphQL query:
API Call:
Example Request:
Example Response:
7. Get Dashboard Info
Once we get a list of all Dashboards, we can select a dashboard to view it. However, just like Reports, before we can view a Dashboard, we need to get information about any filters applied on the Dashboard through parameters.
The API endpoint to get the dashboard's info is 'document' along with other arguments as mentioned in the GraphQL query below. This API endpoint returns the list of parameters for the selected dashboard, along with the default values and information on the source of parameter values (e.g., if they are coming in from a dataset).
If the dashboard info has a dataset reference, we need to make another API call to the datasets API endpoint to fetch the available values for the parameters and show them in a dropdown. The datasets API endpoint requires the dataset Id and the column name as arguments.
The return value is the column name and an array of the distinct values in the column.
GraphQL query:
API Call:
Dashboard Info:
Dashboard Info:
Dataset values:
Example Request
Get Dashboard info:
Get Dashboard info:
Get Dataset values
Example Response:
Dashboard Info:
Dashboard Info:
2. Dataset Values
8. View Dashboard
Once we have the parameter info and the values from the dataset, we can set the values of the parameters by choosing from the list of values from the drop down (if the parameter has default values or values from a dataset).
The step to view a dashboard involves generating the dashboard url with the dashboard ID and the parameter values.
Once the URL is generated, we can set it as the iFrame's source and view the dashboard on the screen.
URL:
Example Request:
Example Response:
The Wyn API does not end here. There are several other API endpoints that will be covered in future articles. As Wyn Enterprise uses GraphQL for its API endpoints, GraphQL also provides a way to explore and run the API endpoints through an interactive tool called GraphiQL.
You can access GraphiQL on your Wyn Enterprise server using the URL "{wynserverURL}/graphiql". You must be logged in to the server to access this IDE.
A sample using the APIs explained above is available for download. Since it is a React application, you will need to run the following commands from the command prompt:
‘npm install’- to install required modules
‘npm run start’- to run the application
The first screen will ask you to enter your Wyn server's URL, the username, and password to log in. Once logged in, you will see a list of Reports and Dashboards. You can select the Report or Dashboard you would like to view.
The parameters panel will appear with a list of parameters (if any). Once you click on 'Run', the selected Report/Dashboard will be displayed in the iFrame on the right.
If it's a report, you can use the 'Save As' or 'Export' button at the bottom of the parameters panel to save and export the report.
For any questions on this article, please email Wyn.Experts@grapecity.com.
Understand the Story Behind Your Data
Need help making sense of your data? Wyn is a web-based BI and data analytics platform that provides greater insight into your data.
Wyn offers built-in tools for report and dashboard creation, data governance, security integration, embedded BI, automated document distribution, and a business-user friendly interface for self-service business intelligence.
Embedding Wyn Enterprise - Additional Resources
For language packs, samples, and custom visuals, explore our GitHub.
Embed WynDashboards in a Web App Using Div
Here, we'll develop a simple web application and embed the Viewer and Designer components using div and the Wyn Dashboards API.
Embed Individual Dashboard Scenarios into a Web App
An overview of Wyn's embeddable BI capabilities and integrate a single scenario/visualization from a complete dashboard.
Hosting Wyn in a Web Application via iFrame
Here, we'll integrate Wyn Enterprise in an ASP.NET Core app via iFrame.
Embedding Wyn Enterprise in a Web App via ReportViewer
How to embed Wyn Enterprise in a Web App using Wyn's own ReportViewer.


