Healthcare Dashboard
Pneumonia & Influenza
Gain real-time figures on the impacts of Pneumonia and Influenza.

Overview:
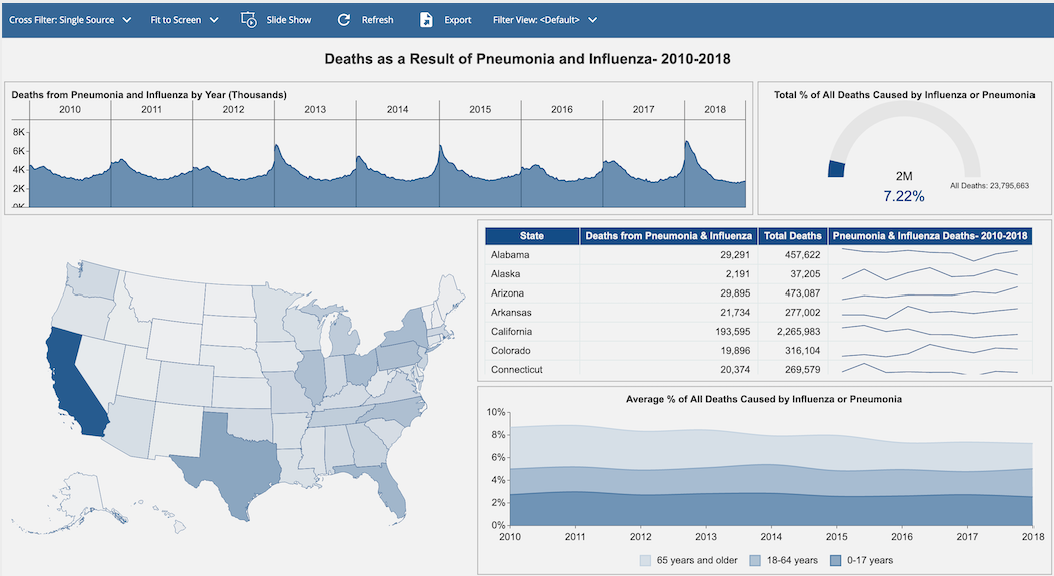
This healthcare dashboard displays the U.S. Pneumonia and Influenza mortality rates. This dashboard includes a breakdown of cases by state, the number of cases, by month, number of cases by age, and season.
Pneumonia & Influenza Healthcare Dashboard
Audience:
- Physicians Assistants
- Nurse Practitioners
- Physicians
- Registered Nurses
- Nurse Anesthetists
- Pediatricians
- Pediatrics Registered Nurses
- Certified Vaccinators
- Licensed Practical Nurses
- RN Injection Specialists
- Clinical Staff Members
- Public Health Nurses
- Pharmacy Dispensers
- Clinics for Non-Emergency Outpatient Care
- Pharmacy Assistants
- Pharmacy Technicians
- Pharmacists
- Pharmacy Managers
- Pharmacy Specialists
- Clinical Pharmacists
- Pharmacologists
- University Healthcare
KPIs:
- Average Hospital Stay
- Medical Equipment Utilization
- Average Patient Wait Time
- Patient Drug Cost Per Stay
- Average Treatment Charge
- Insurance Claim Processing Time
- Emergency Room Wait Time
- Average Cost Per Discharge
- Readmission Rates
- Patient Safety
- Immunization Rate
- Time Between Symptom Onset and Hospitalization
- Patient Mortality Rate
- Staff-to-Patient Ratio
- Total Prescriptions
- Average Prescriptions per Day
- Average Return-to-Stock Prescriptions per Day
- Prescriptions and Sales per Top Prescriber
- Prescriptions and Sales per Top Patient
- Room Turnover


