Retail Dashboard
Profit & Loss
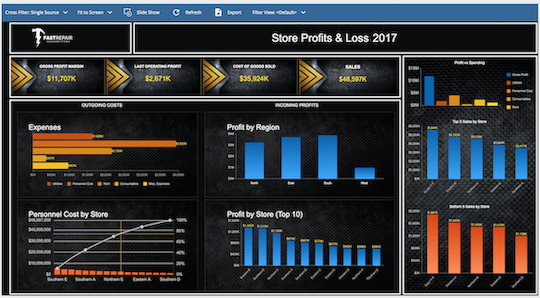
With a profit and loss retail dashboard, you can track profit margin, operating profit, expenses, profits per region, and location.

Overview:
Visualize critical financial measures such as COGS, net sales, net profit, and profit vs. spending per region. This dashboard provides an easy visual source for reviewing complex financial data over a period of time.
Profit & Loss Retail Dashboard
Audience:
- CFO
- Area Manager
- Assistant Merchandise Manager
- Assistant Store Manager
- Associate Product Manager
- Sales Manager
- Customer Service Manager
- Manager of Retail Strategy Communications and Processes
- District Sales Manager
- Divisional Manager
- General Manager
- Global Logistics Supervisor
- Regional Manager
- Retail Associate Store Manager
- Retail Food Service Manager
- Sales Manager
- Store Manager
- Warehouse Manager
- In-Store Assistant Branch Manager
KPIs:
- Gross Profit Margin
- Operating Profit
- Cost of Goods Sold (COGS)
- Sales
- Expenses
- Labor Cost per Employee
- Total Revenue
- ROI on Total Labor Costs
- Net Income
- Net Credit Sales
- Quick Ratio
- Average Accounts Receivable
- Accounts Receivable Turnover Ratio
- Current Ratio
- Customer Acquisition Ratio


