BI for Manufacturing
Business intelligence gives manufacturers the ability to take information and data that might once have been siloed across the factory floor, and assimilate them into one convenient access source.
Inventory Tracking
Track inventory to fluctuations in demand; adjust materials and products accordingly.
Measure Efficiency Effectively
Maximize the efficiency of your operations by determining optimal warehouse configurations and floor plans.
End-to-end Supply Chain Visibility
CIOs and CDOs can establish end-to-end supply chain visibility and properly prioritize customers, suppliers, and partners while eliminating data silos.
Manufacturing Cycle Tracking
The manufacturing cycle must be as short as possible to maintain profitability while still enabling the production of a quality product.
Improve Assembly Line Process
Enhance assembly line process by analyzing the end results of the line and returns.
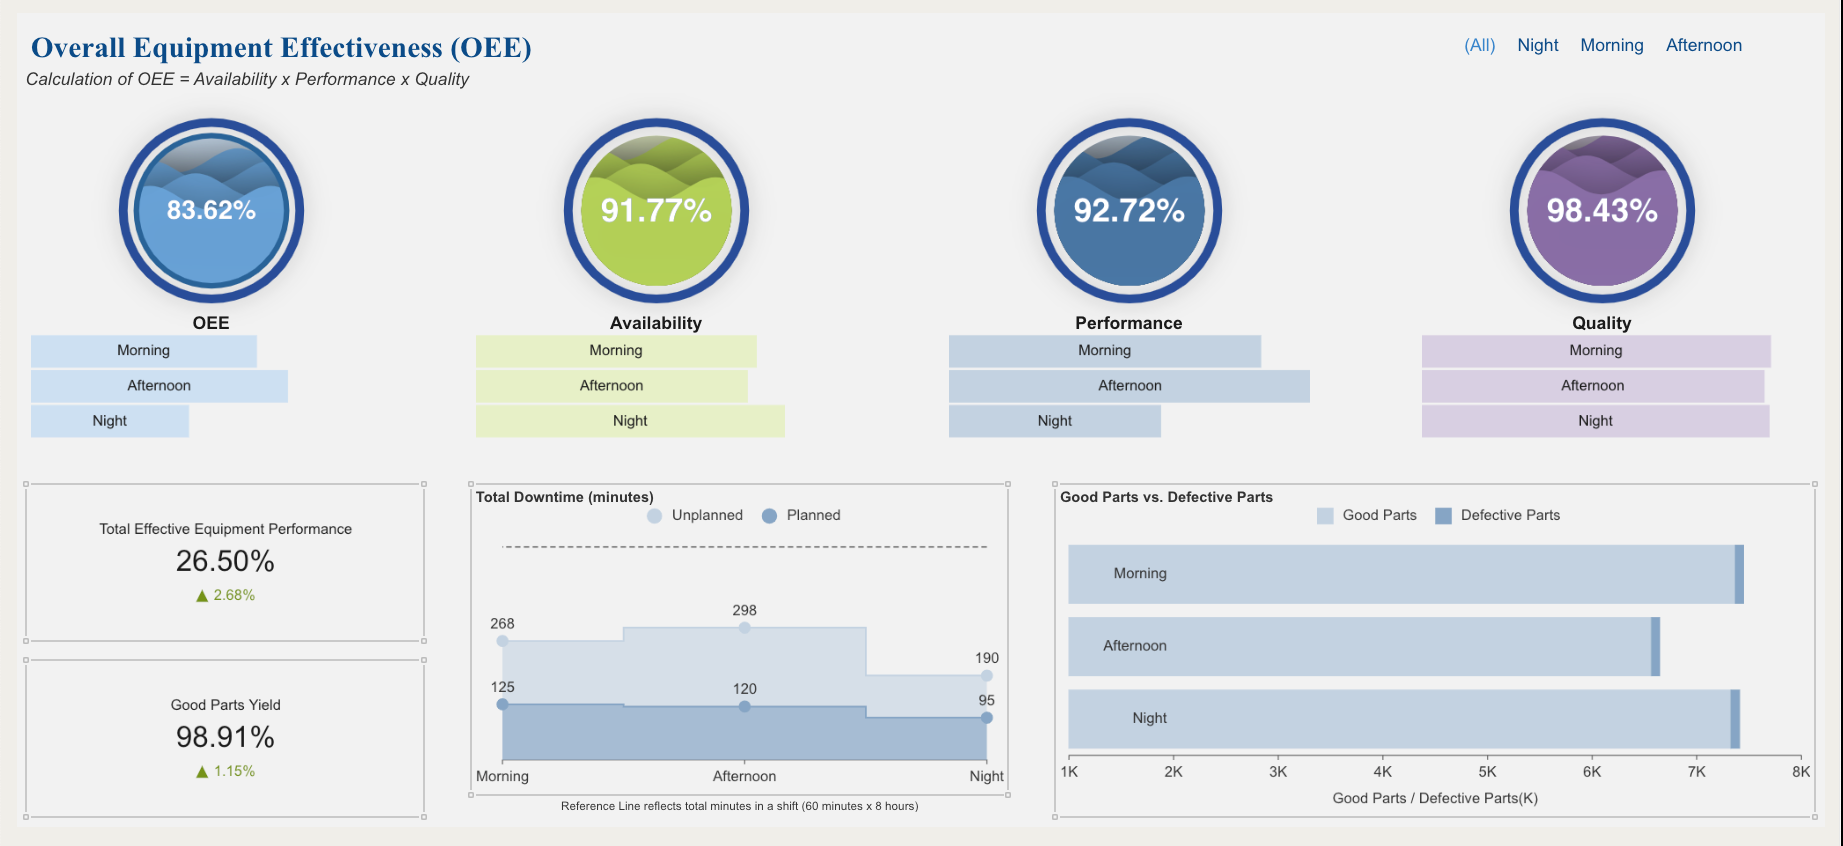
Performance KPIs and Scorecards
Visualize your profitability, value management, COGS, profit margins, credit, collections, and more.
How to Improve Manufacturing Processes with Business Intelligence
Business intelligence is used to improve manufacturing processes by assessing the profit contribution of individual segments, product lines, and customers through the information that reveals the overall margin spread.
A Guide to Effective Manufacturing BI Dashboard Design
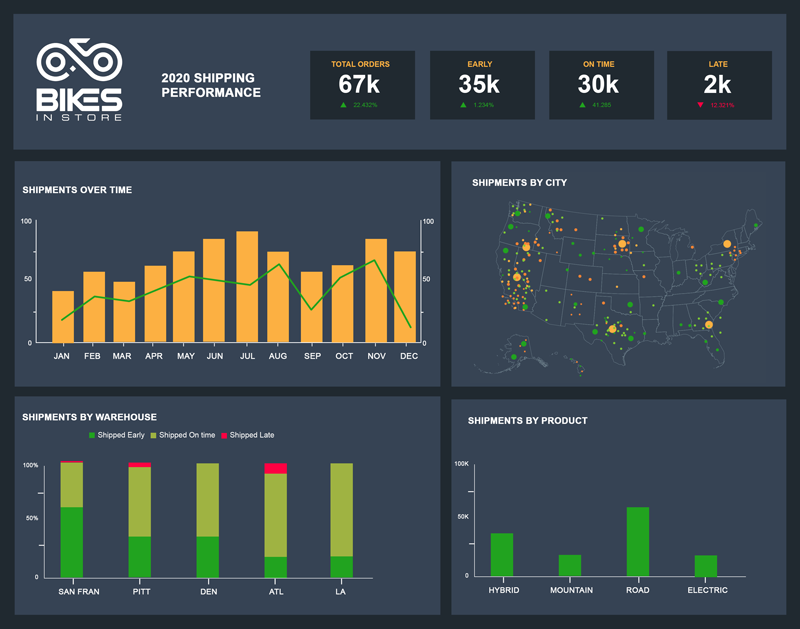
A manufacturing operations BI dashboard is a key component of a business intelligence system. Benefits of manufacturing dashboards include better resource utilization, less waste, more output, and improved profitability.

Reports for Manufacturing
Manufacturing BI reports take the long-view and assemble information into digestible summaries or transitional details.
- Inventory reports
- Invoices
- Predictive reports

Eliminate Data Silos & Enable a Single Source of Truth
Identify patterns in your data and measure manufacturing efficiency with embedded BI.
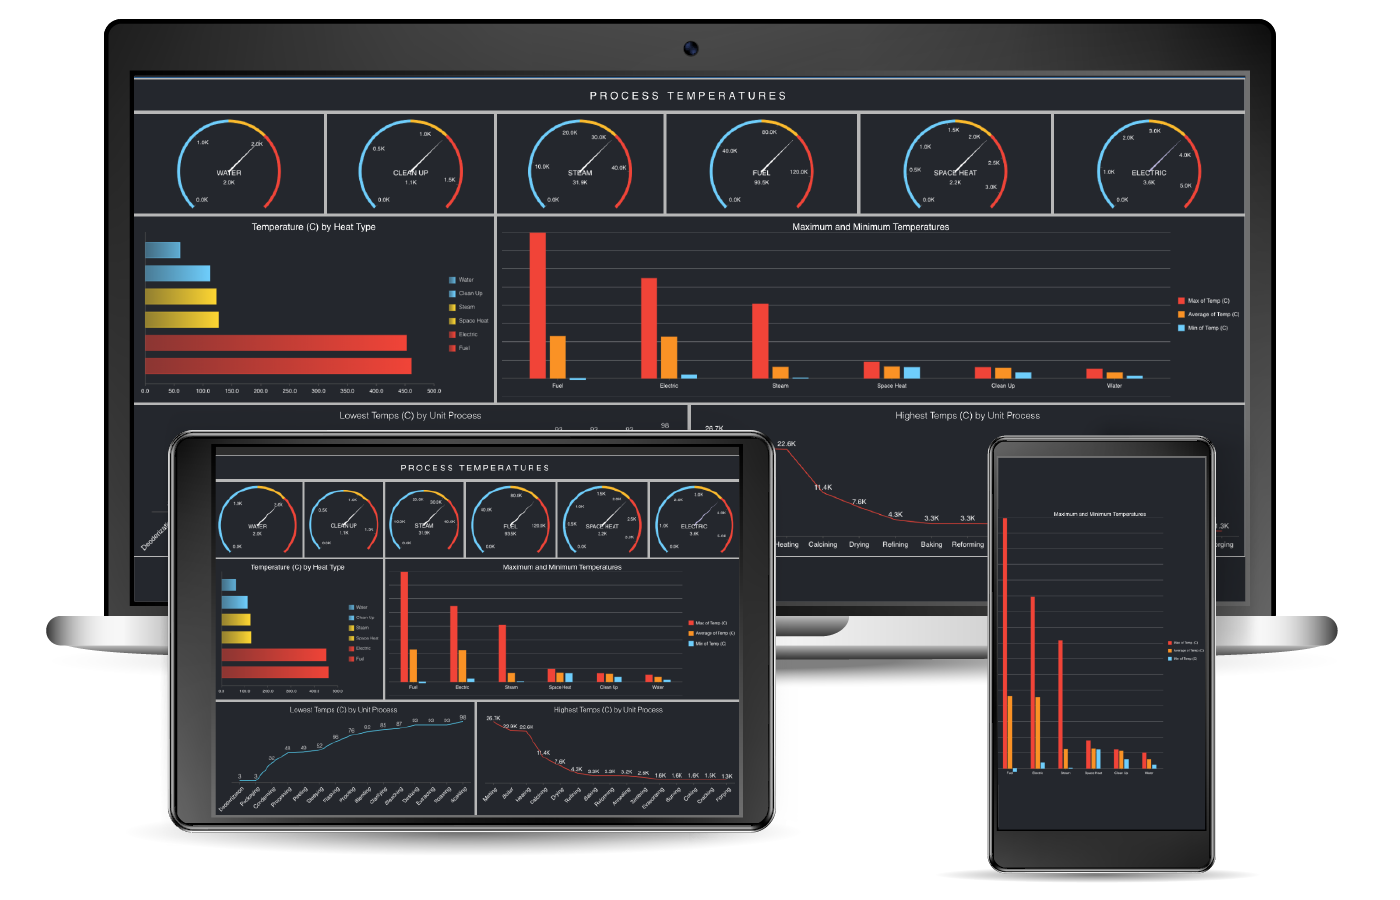
Large Screen Data Visualization
Gather and display data on a large-screen visualization in real-time.
- Rich visualization charts
- Animations and special effects
- Multi-source real-time data
- Interactive exploration
Self-service Dashboards
Easy to use dashboards with a drag-and-drop design for self-service BI.
- No UX, coding, or data science skills are required
- Drag-and-drop controls enable non-technical end-users to visualize and analyze data
Powerful BI Reporting Module
Streamline your operational and transactional reporting processes. Leverage Wyn's powerful and fast reporting engine to develop complex interactive reports.

Single Source of Truth
Embedded BI enables a current and consistent stream of data, giving decision-makers access to a single source of the truth.
Save Time & Optimize Resources
Self-service business intelligence empowers your teams to answer questions and drill-down on data. No more wait time.
- Eliminates the need for the data warehouse or related database licensing costs.
- Eliminates disparate data silos
- Reduces dependency on IT teams

See What our Customers are Saying:


