In this guide, we will explore the powerful customization features introduced in version 6.1 of the Dashboard Designer and Dashboard Viewer integration. With the help of new APIs, technical professionals can now fine-tune the user interface, enable read-only datasets, and seamlessly hide the side-panel to deliver a tailored user experience.
Installing and Running the Code Sample
To begin customizing, follow these simple steps:
-
Download and unzip the provided sample code into your desired directory.
-
Launch Visual Studio and open the folder containing the sample code.
-
Right-click on the master folder and choose "Open in Terminal".
-
Install the Wyn Integration package by running the command "npm install".
-
Open Command Prompt and navigate to the directory where the sample code is located.
- Start the server by running the command "http-server".
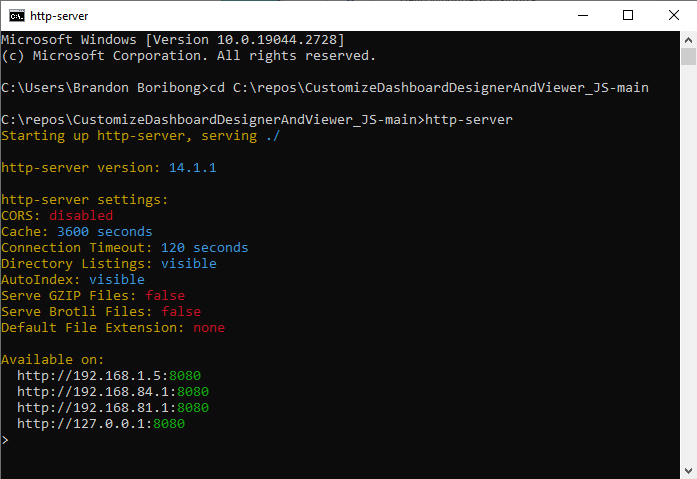
7. Access the sample code in your browser by visiting http://localhost:8080/.
After following these steps, you will have the sample code up and running, ready to explore the extensive customization capabilities of the Dashboard Designer and Dashboard Viewer integration. Let's dive into the world of advanced customization and create unique, tailored dashboard experiences for your end-users.
Customizing the Dashboard Viewer
When implementing the Dashboard Viewer, users have the flexibility to control various aspects of the previewed dashboard. Here are three key use cases for customizing the viewer:
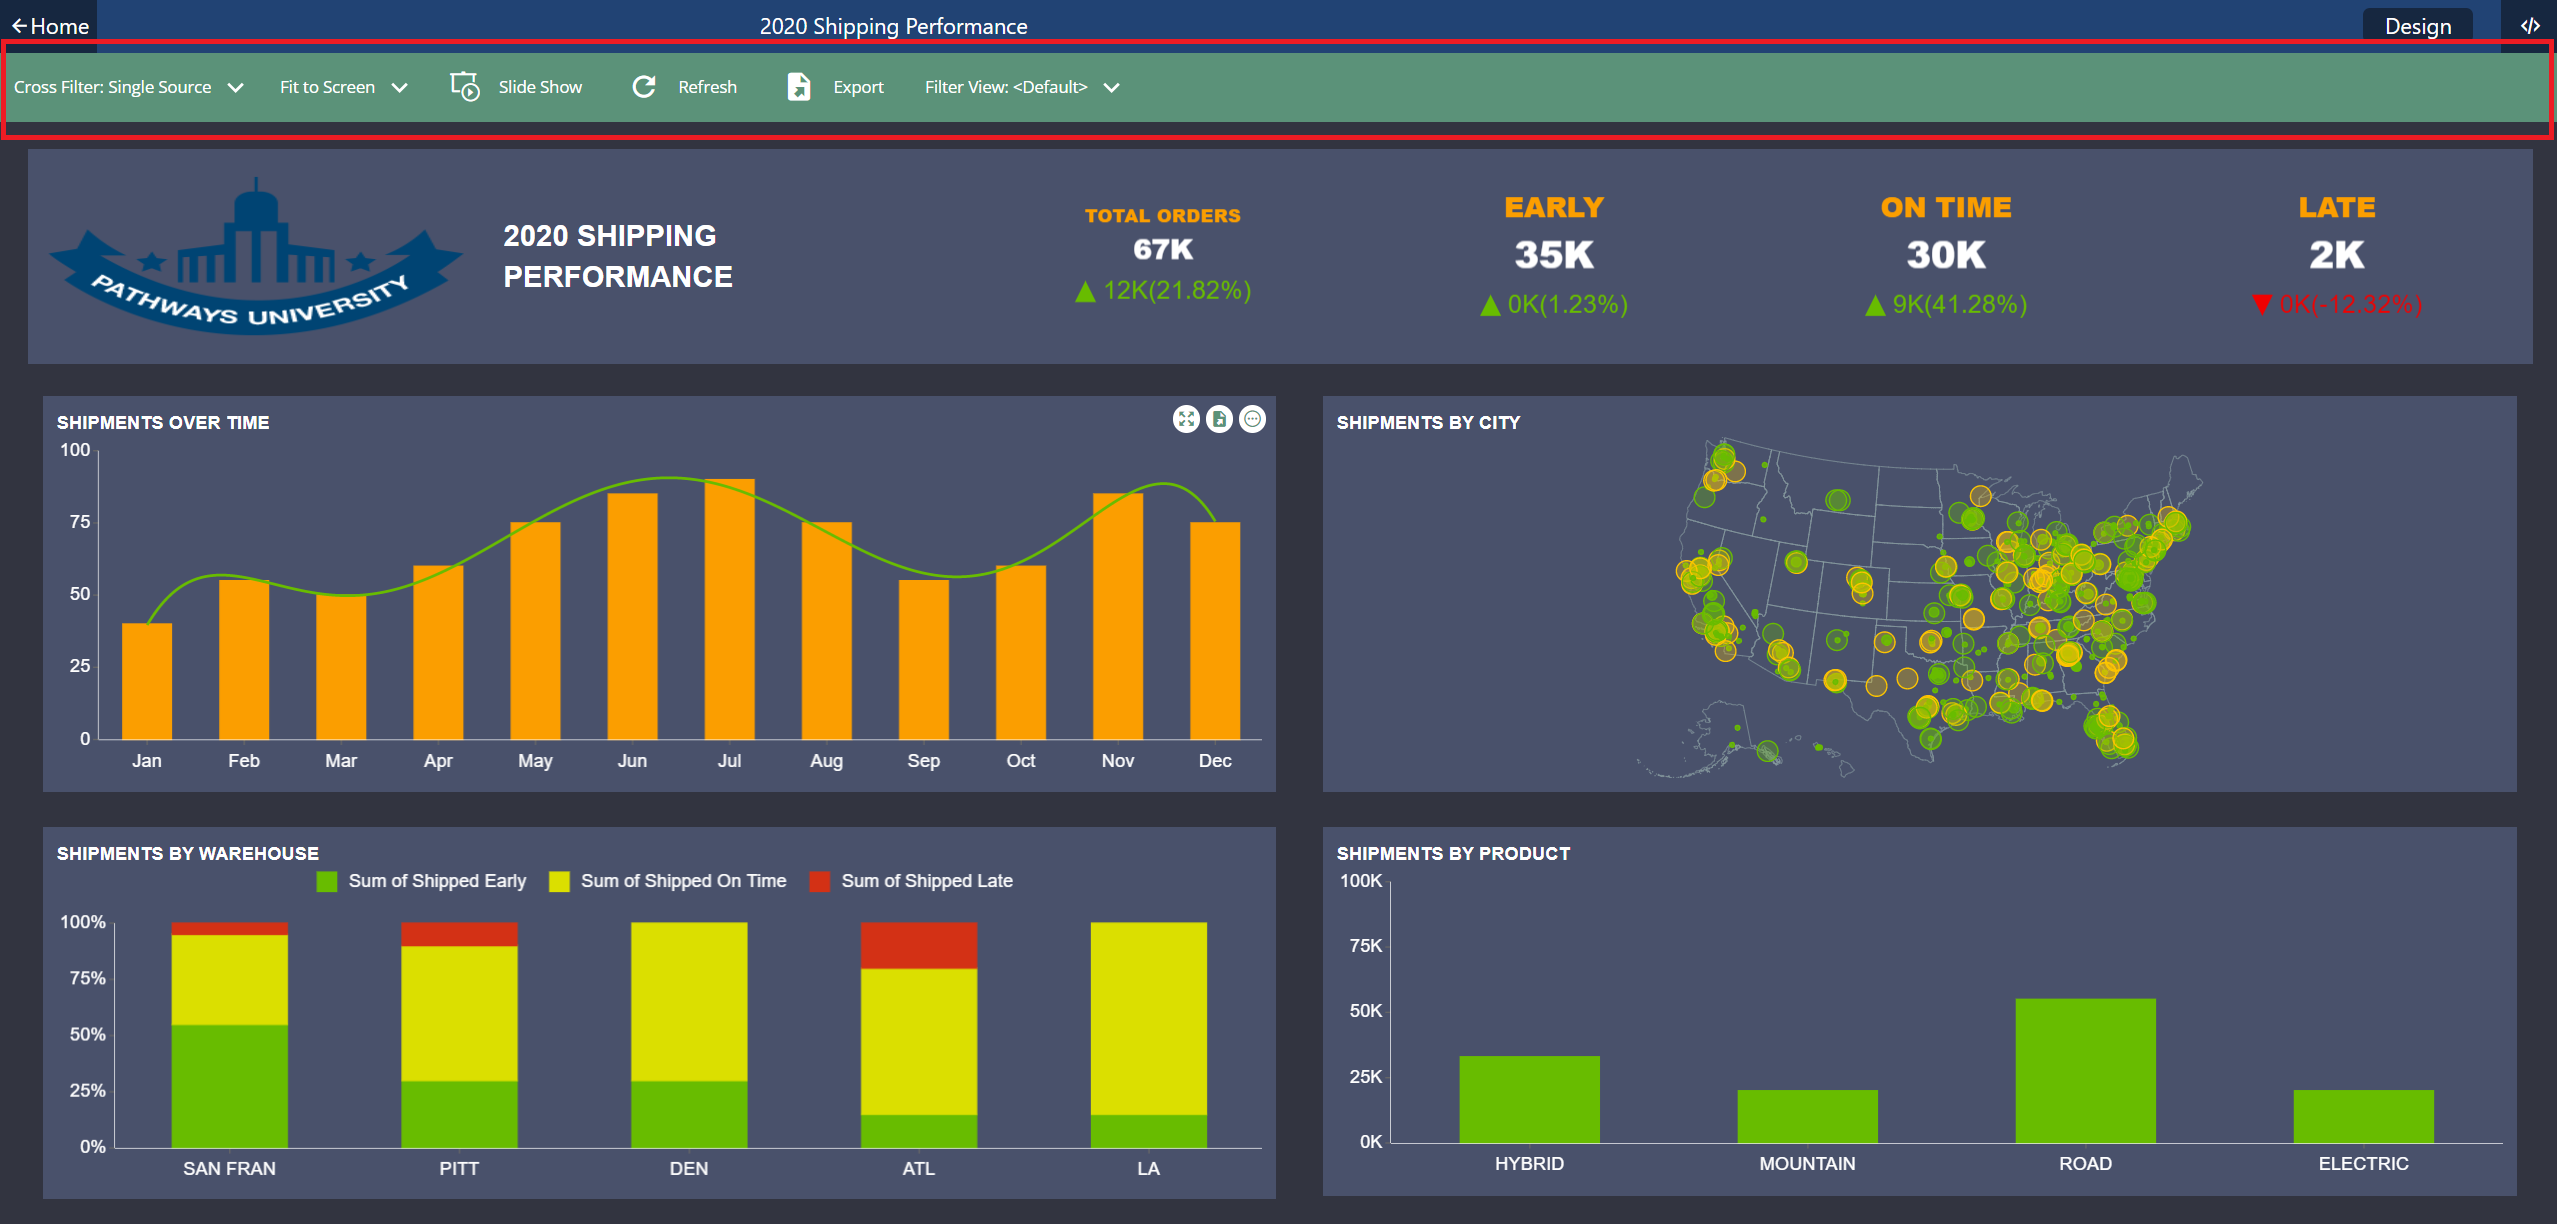
Use Case 1: Displaying the Toolbar during Dashboard Preview
Imagine you are finalizing a critical sales dashboard for an executive presentation. Your manager wants a sneak peek but without the distracting toolbar.
With Wyn Enterprises' dashboarding tool, you effortlessly set the "toolbar" option to 'hide' for the preview. Now, when you click "Preview," the dashboard displays flawlessly, sans the toolbar.
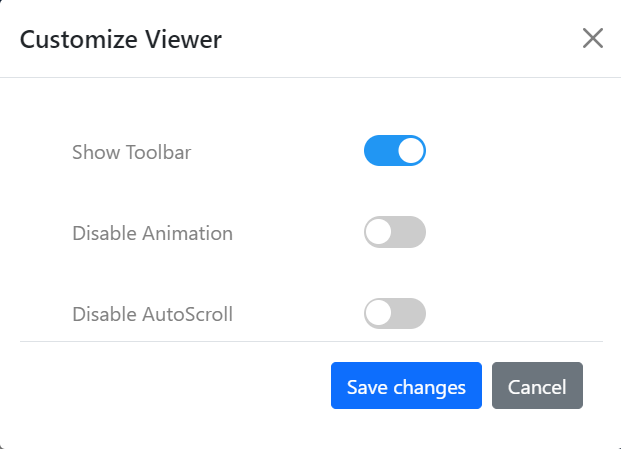
toolbar: 'show' | 'hide',By controlling the toolbar's visibility, you've created a professional, distraction-free preview, ensuring your data takes center stage, and your presentation makes a lasting impact.
In this scenario, Wyn Enterprises' dashboarding tool empowers you to perfect your presentation, highlighting its flexibility and precision.
To control the visibility of the toolbar when viewing a dashboard, you can specify the "toolbar" option as either 'show' or 'hide'. By default, the toolbar is set to 'show'.
Here's an example of how to implement this feature:
wynIntegration.createDashboardDesigner({
    baseUrl: baseUrl,
    dashboardId: dashboardId,
    lng: 'en',
    token: token,
    features: {
        toolbar: 'hide'
    }
}, '#wynroot').then(ins => {
    viewer = ins;
});
Use Case 2: Disabling Animations on Dashboard Scenarios
Imagine you are a data scientist preparing an important presentation using a dynamic dashboard that showcases sales trends over time. However, you are aware that excessive animations can sometimes distract from the data's core message.
As you prepare for the presentation, you decide to disable animations using Wyn Enterprises' dashboard customization options. This is easily achieved by toggling the "disableAnimationViewer" option to 'on'. By default, animations are enabled, but you know that for this specific scenario, less is more.

During the presentation, when you open the dashboard, there are no flashy distractions. The data smoothly appears without unnecessary animations, keeping the audience focused on the content. Even when you select an item as a filter, the transition is seamless but not distracting. The absence of excessive animations helps convey the data's significance clearly and without unnecessary embellishments.
In this case, Wyn Enterprises' dashboarding tool gives users the control to disable animations when needed, ensuring a streamlined and impactful data presentation.
If you prefer to disable animations on the dashboard, you can toggle them on or off using the "disableAnimationViewer" option.
disableAnimationViewer: true | falseHere's an example of how to implement this feature:
wynIntegration.createDashboardDesigner({
    baseUrl: baseUrl,
    dashboardId: dashboardId,
    lng: 'en',
    token: token,
    features: {
        disableAnimationViewer: true
    }
}, '#wynroot').then(ins => {
    viewer = ins;
});Use Case 3: Disabling Auto-Scroll on Dashboard Scenarios
Imagine you are a data analyst working on a complex pivot table within a dashboard, a vital tool for tracking inventory levels across multiple warehouses. However, you have realized that auto-scrolling, which is enabled by default, can sometimes disrupt your workflow.
In this scenario, know you can rely on Wyn Enterprises' dashboard customization options to regain control. By toggling the "disableAutoScrollViewer" option to 'on,' you can disable auto-scroll for all scenarios.
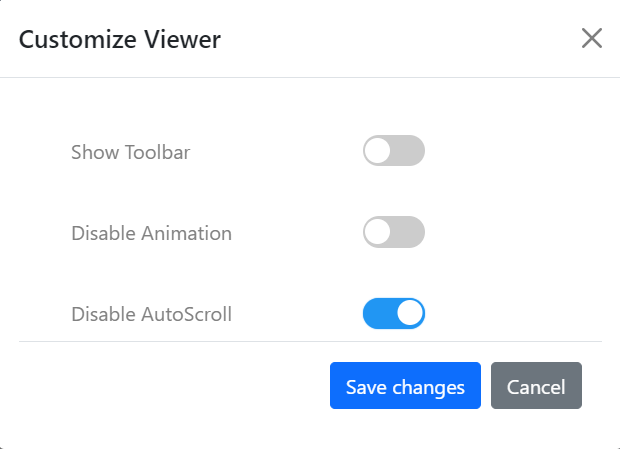
Now, when you open the dashboard, the pivot table remains static, and there are no unexpected auto-scrolling interruptions. You can seamlessly analyze the data, make critical inventory decisions, and update the dashboard without disruptions caused by auto-scroll.
In this use case, Wyn Enterprises' dashboarding tool empowers users to customize their experience, enhancing the ability to work with precision and accuracy.
Here is how disableAutoScrollViewer is enabled or disabled:
disableAutoScrollViewer: true | false Here's an example of how to implement this feature:
wynIntegration.createDashboardDesigner({
    baseUrl: baseUrl,
    dashboardId: dashboardId,
    lng: 'en',
    token: token,
    features: {
        disableAutoScrollViewer: true
    }
}, '#wynroot').then(ins => {
    viewer = ins;
});By leveraging these viewer integration options, you can tailor the appearance and behavior of the Dashboard Viewer to suit your specific requirements, providing a more customized and seamless user experience.
Customizing the Dashboard Designer
The Dashboard Designer integration offers developers the ability to embed the designer into their web applications while allowing for customization of the designer itself. With Wyn, developers can tailor the dashboard designer to meet their specific needs. Let's explore some common user scenarios:
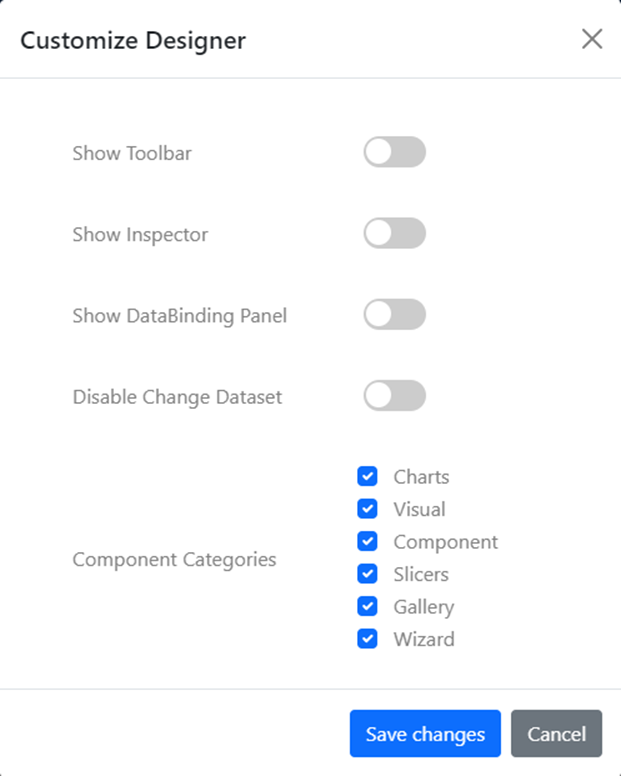
Use Case 1: Displaying Only Visualization Elements and Hiding the Designer Toolbar
Imagine you are a dashboard designer, and you need to present your work to your manager. The catch is, you want to avoid any accidental changes while showcasing your project.
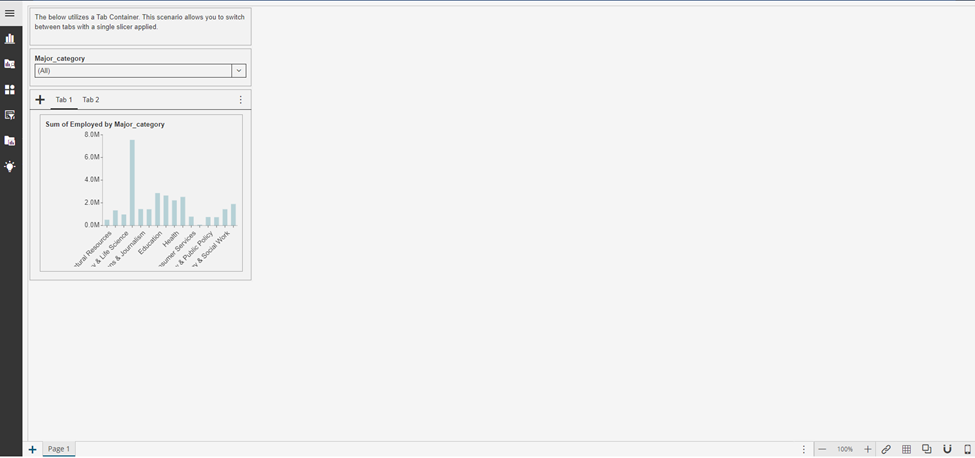
With Wyn Enterprises' dashboard customization options, this is effortless. You can hide the dashboard designer toolbar by setting the "toolbar" option to 'hide.' This removes functions like Save and Preview.
To control the visibility of the toolbar when launching the designer, you can use the "toolbar" option:
toolbar: 'show' | 'hide', Now, you can confidently present your dashboard without the risk of unintended saves. Your manager can review your work, provide feedback, and discuss improvements without any distractions.
Wyn Enterprises' dashboarding tool gives you the control you need for a smooth and secure presentation, ensuring a professional workflow.
Specify the value as 'show' or 'hide'. By default, the toolbar is set to 'show'. Here's an example:
wynIntegration.createDashboardDesigner({
    baseUrl: baseUrl,
    dashboardId: dashboardId,
    lng: 'en',
    token: token,
    features: {
        toolbar: 'show',
    }
}, '#wynroot').then(ins => {
    viewer = ins;
});
Use Case 2: Hiding the Inspector Panel
Imagine you are a dashboard designer, and you are tasked with seamlessly adding dashboard scenarios to your project. You want to demonstrate to your team the intuitive drag-and-drop functionality of Wyn Dashboards without the Inspector Panel blocking a large portion of the screen by default.
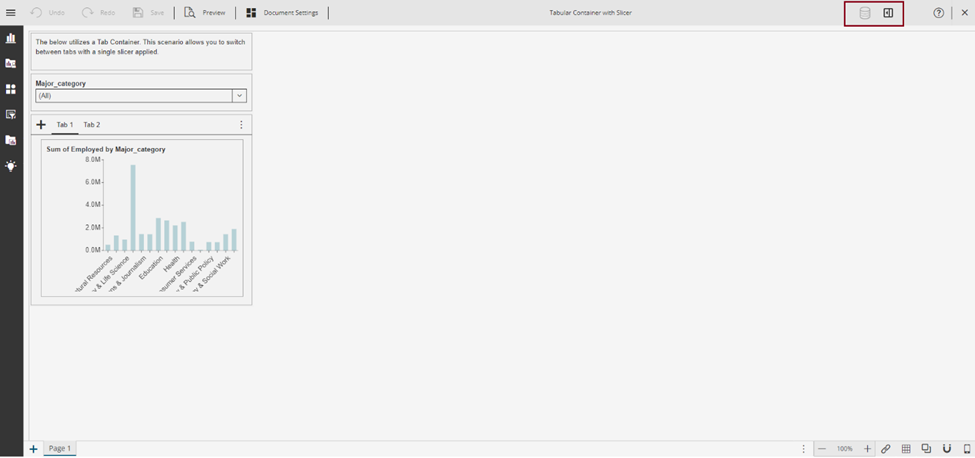
With Wyn Enterprises' dashboarding tool, it's a breeze. You can hide the Inspector panel when launching the designer by using the "showInspector" option. Simply set the value to 'false.' By default, the Inspector panel is 'true,' but you can effortlessly turn it off.
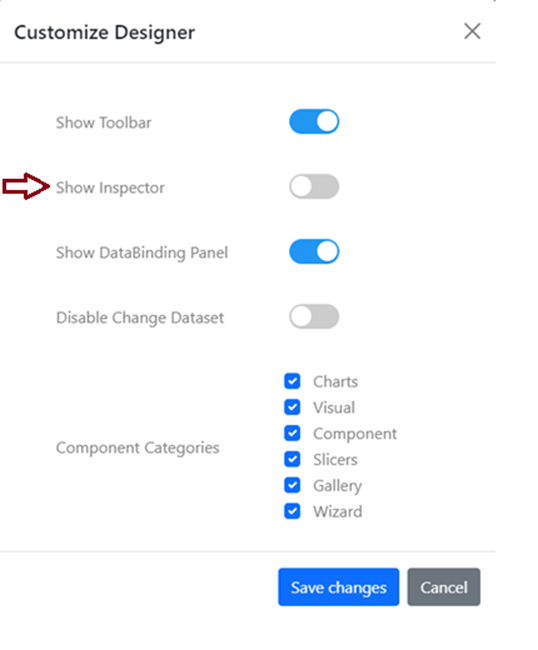
showInspector: true | false,Now, as you drag and drop your chosen dashboard scenario into the design environment, you can focus solely on the design process. No more worrying about unintended changes to settings. The tool empowers you to maintain a streamlined design workflow.
Wyn Enterprises' dashboarding tool offers you the control you need to keep your dashboard settings intact while making design tasks easy and efficient.
Here's an example:
wynIntegration.createDashboardDesigner({
    baseUrl: baseUrl,
    dashboardId: dashboardId,
    lng: ‘en’,
    token: token,
    features: {
        showInspector: true
    }
}, ‘#wynroot’).then(ins => {
    viewer = ins;
});
Use Case 3: Hiding the Data Binding Panel
Imagine you are a data steward, tasked with designing a dashboard while safeguarding sensitive data and ensuring the integrity of data bindings.
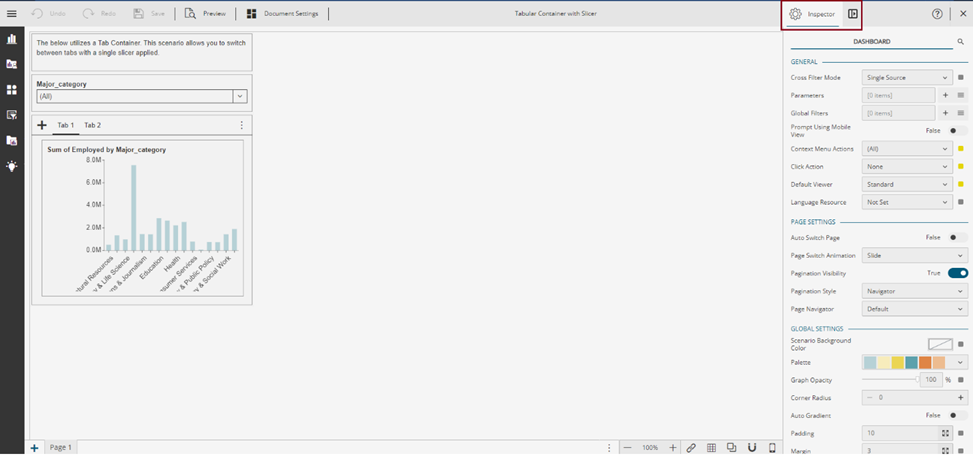
With Wyn Enterprises' dashboarding tool, this is easy to accomplish. You can hide the data binding panel by setting the "showDataBindingPanel" option to 'false' when launching the designer. By default, it is set to 'show.'
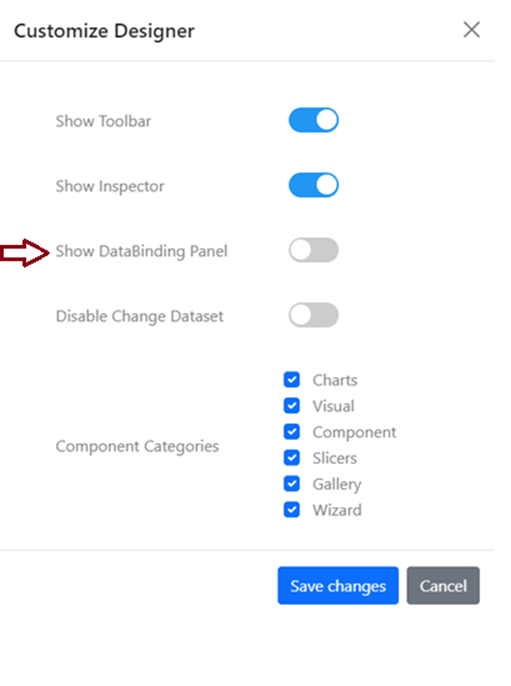
showDataBindingPanel: true | false,Now, you can design your dashboard with confidence, knowing that viewers won't access sensitive data or tamper with data bindings unintentionally. This control helps protect data privacy and maintains the stability of your data bindings.
Wyn Enterprises' dashboarding tool empowers you to strike the right balance between sharing data and protecting it, ensuring a secure and reliable design process.
Here's an example:
wynIntegration.createDashboardDesigner({
    baseUrl: baseUrl,
    dashboardId: dashboardId,
    lng: 'en',
    token: token,
    features: {
        showDataBindingPanel: true
    }
}, '#wynroot').then(ins => {
    viewer = ins;
});
Use Case 4: Hiding the Dataset Selector in the Data Binding Panel
Imagine you are a data manager and you want to ensure viewers cannot access or modify the dataset selection within the data binding panel of your dashboard.
With Wyn Enterprises' dashboarding tool, this is straightforward. By using the "disableChangeDataset" option and setting it to 'true,' you disable the dataset selector. By default, users can change the binding dataset.
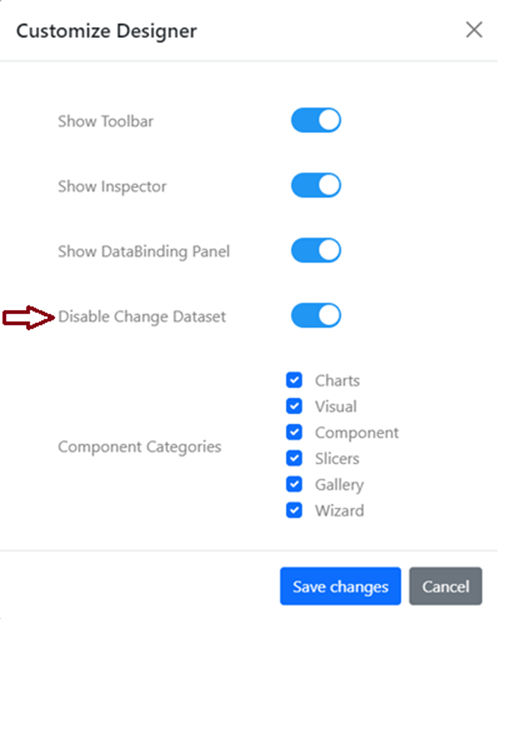
disableChangeDataset: true | false,Now, you can confidently share your dashboard, knowing that viewers will not alter the dataset selection unintentionally. This control helps safeguard your data and ensures the integrity of your dashboard's data bindings.
Wyn Enterprises' dashboarding tool empowers you to maintain data security and data binding consistency, providing a reliable and controlled data presentation.
Here's an example:
wynIntegration.createDashboardDesigner({
    baseUrl: baseUrl,
    dashboardId: dashboardId,
    lng: 'en',
    token: token,
    features: {
        disableChangeDataset: true
    }
}, '#wynroot').then(ins => {
    viewer = ins;
});
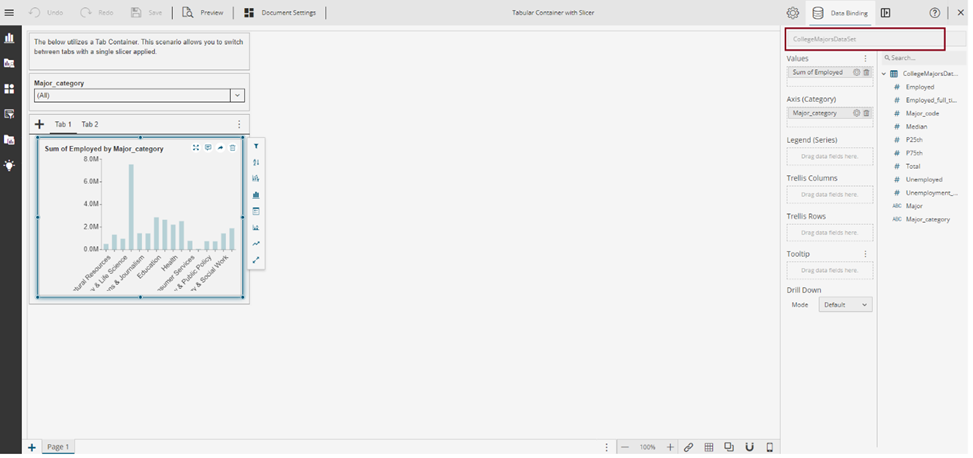
When the disableChangeDataset option is true, the dataset selector will be disabled:
Use Case 5: Customizing Toolbox Item Categories
Imagine you are a dashboard designer, and you want to create a unique dashboard with specific toolbox item categories. You do not want all categories cluttering your workspace.
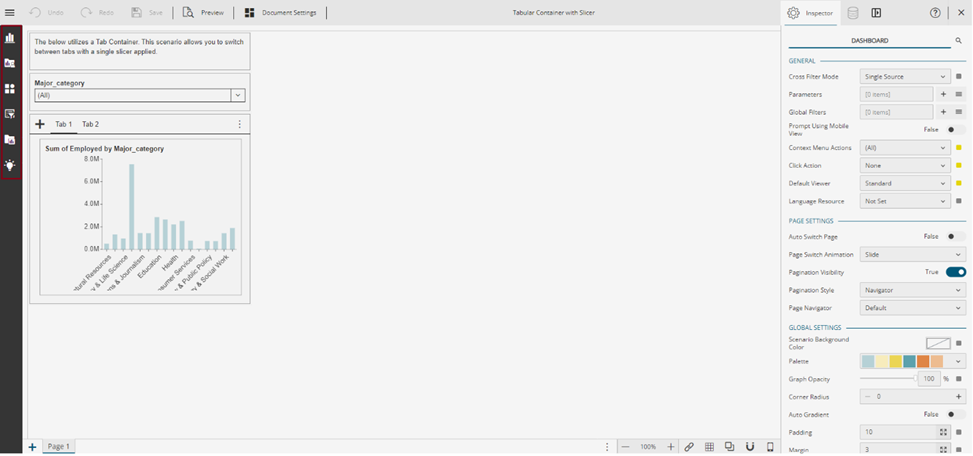
Wyn Enterprises' dashboarding tool allows you to do just that. With the "componentCategories" option, you can specify an array of categories you wish to display in the left menu. By default, all categories are shown.
Default componentCategories (notice the red box on the left side):
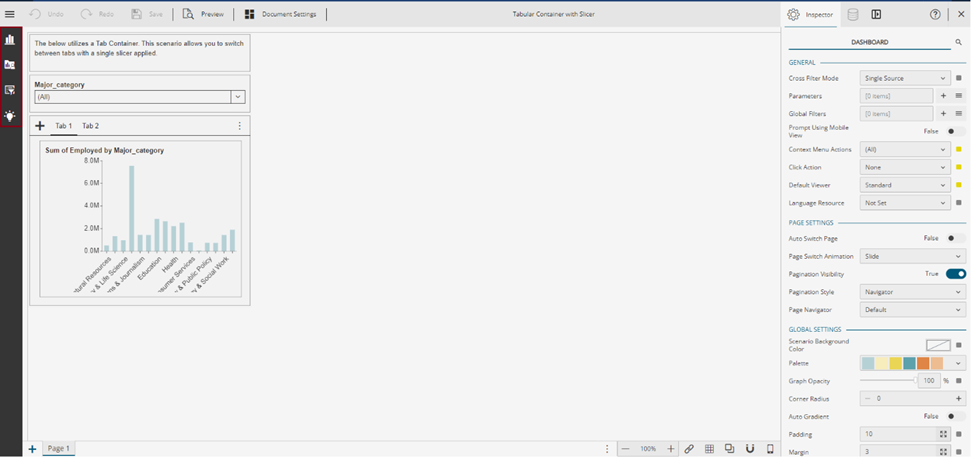
Custom componentCategories (notice the custom choice of icons):
You can customize the toolbox item categories by using the "componentCategories" option. Specify an array of categories that you want to display in the left menu. By default, all categories are displayed.
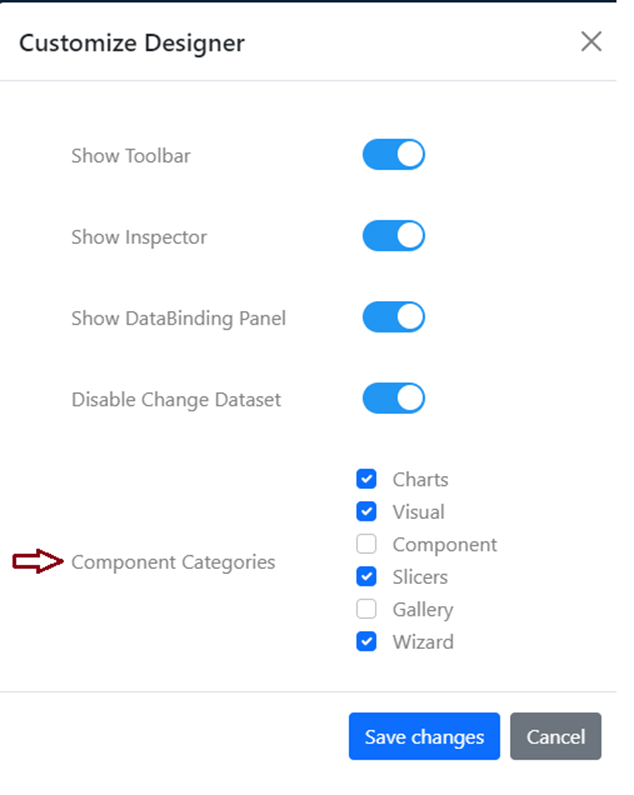
componentCategories: [
    "charts",
    "visual",
    "slicers",
    "wizard"
]
In this example, only the chosen categories will appear in your toolbox menu, offering a streamlined design experience, such as the screenshot above.
Here is a fuller code example:
wynIntegration.createDashboardDesigner({
    baseUrl: baseUrl,
    dashboardId: dashboardId,
    lng: 'en',
    token: token,
    features: {
        componentCategories: ['charts', 'visual', 'slicers', 'wizard']
    }
}, '#wynroot').then(ins => {
    viewer = ins;
});
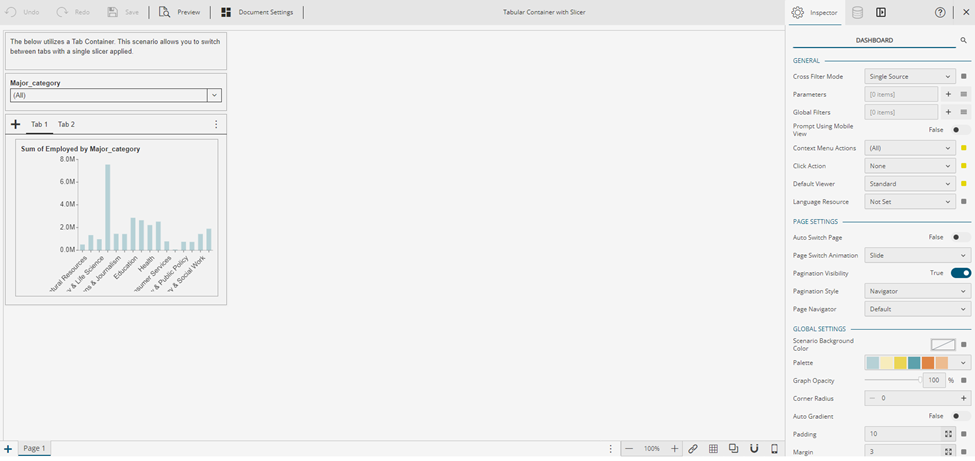
And here is the bonus: If you set "componentCategories" as an empty array, the entire toolbox menu bar disappears, providing you with a clean slate for your creative dashboard design.
*Note: The priority of this option is higher than the designer setting in the Admin Portal and will take precedence over the designer setting in the Admin Portal.
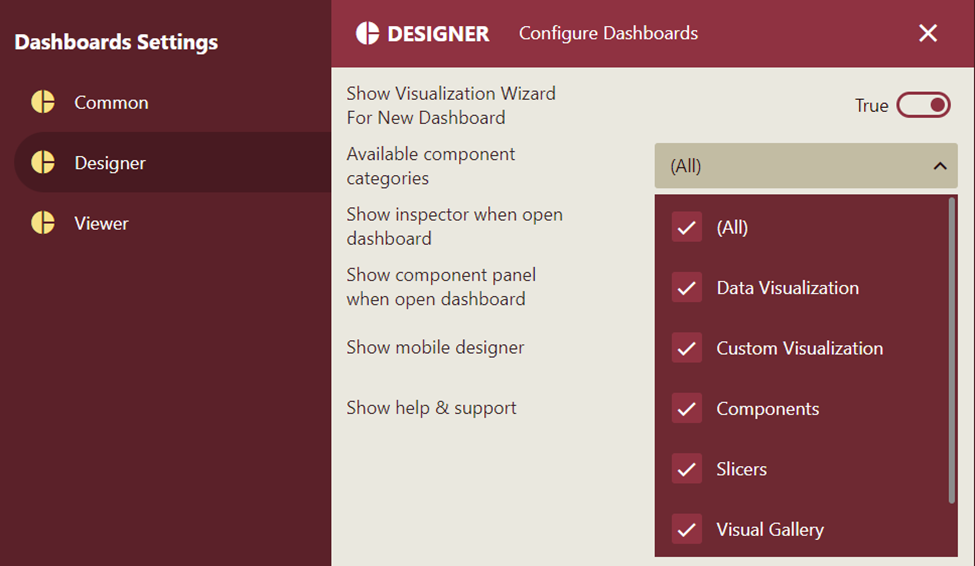
In conclusion, customizing the dashboard designer and viewer through API integration provides users with a flexible method to visualize their business scenarios while maintaining the same appearance style as their original system. With Wyn's powerful customization options, such as customizing components categories, hiding/showing panels, and more, developers can achieve their analytic goals and create a personalized and tailored dashboard experience. By harnessing the power of the Dashboard Designer and Dashboard Viewer integration, developers can unleash the full potential of data visualization and deliver impactful insights to their users.
For any questions on how to use these settings, please reach out to the Wyn Experts support team.


