There’s a lot of data out there. Business users often try to make sense of all that data in a spreadsheet—which is painstaking and time-consuming—or they send a request to the IT department.
In turn, an IT staff member (who likely already has too much on their plate) has to codify the query, generate a report and then send the results back to the user, which can take days. While this process is typically automated for regular reports, when it comes to creating one-off queries, it’s just another item on IT’s to-do list.
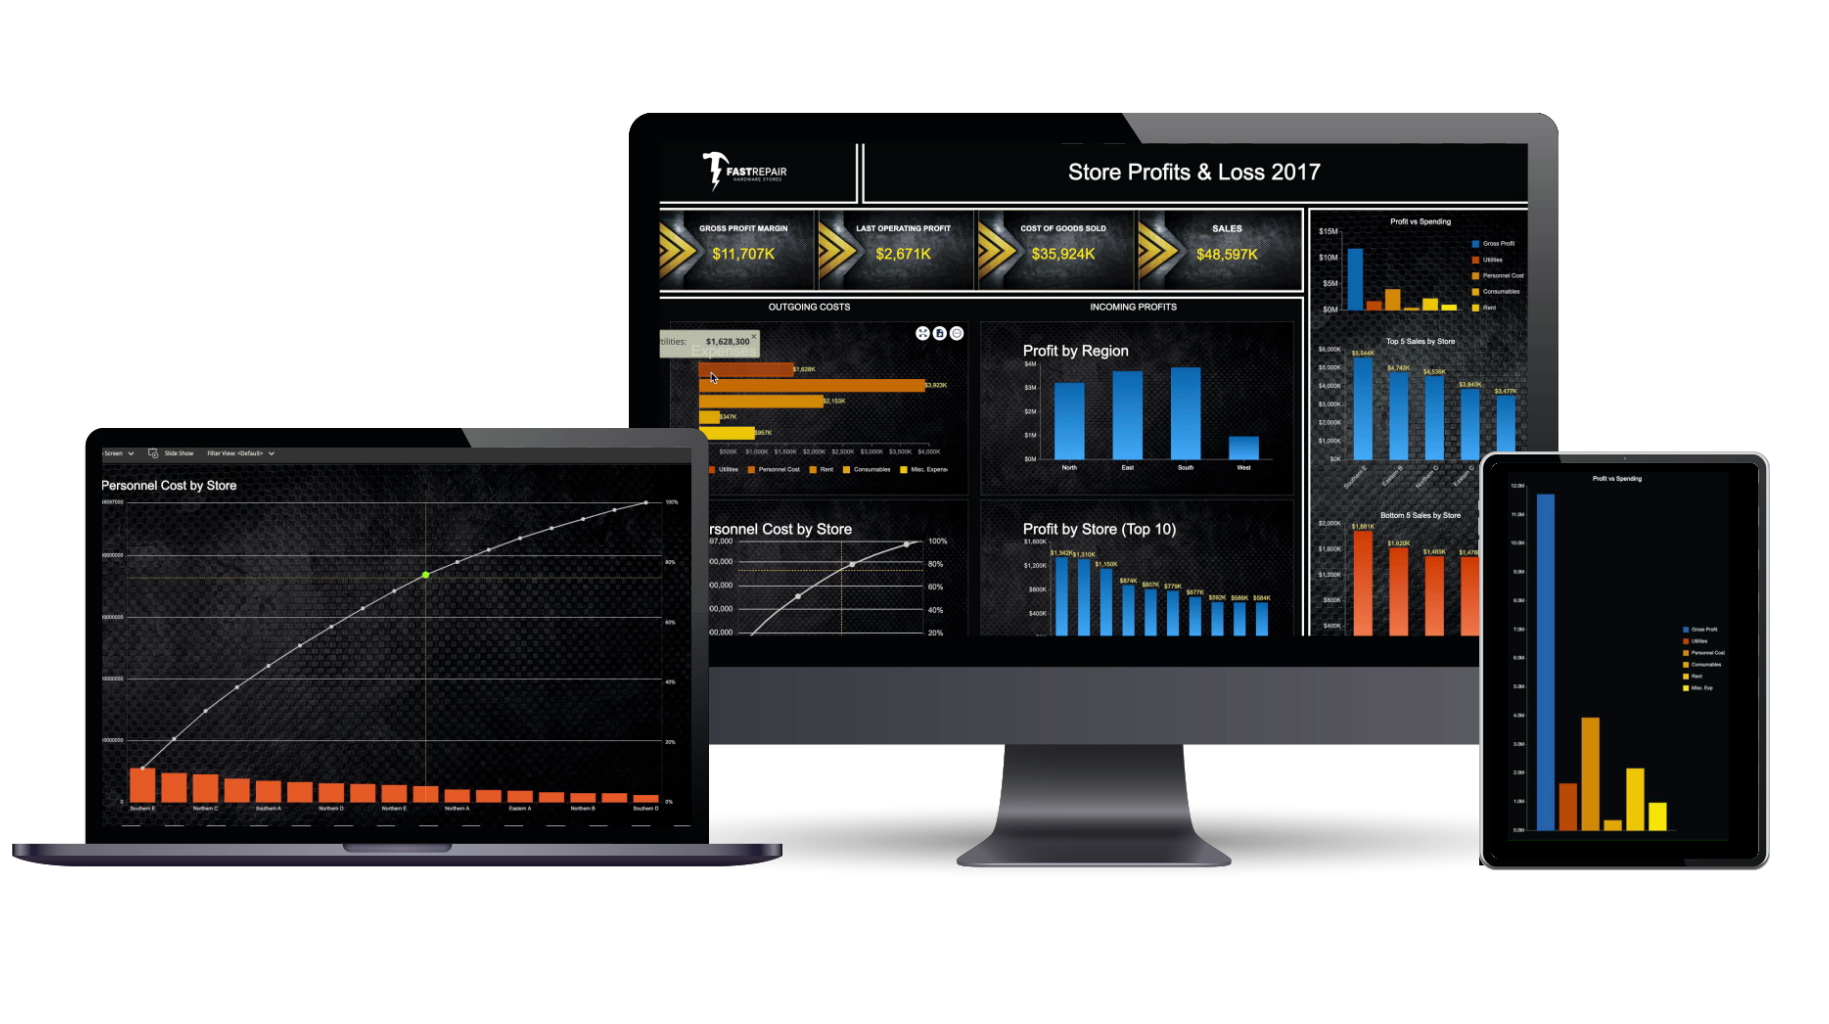
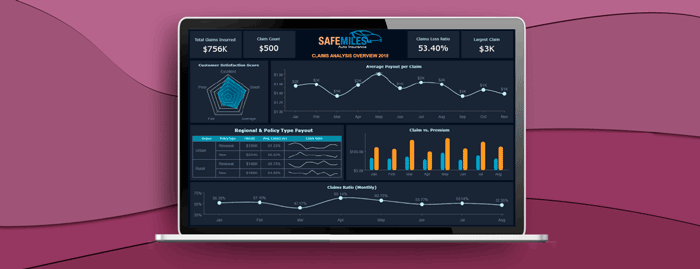
Business intelligence tools that offer ad-hoc reporting capabilities are a game-changer, for business users and IT departments. If business users have questions, they can create their own queries on the fly and generate their own reports—no UX, coding, or data science skills required.
Business users can create a custom report when needed in a format they understand, allowing them to make informed decisions on the fly. Over time, this can improve operational efficiency and increase profits, giving their organization a competitive edge.
Additionally, several different industries can benefit from ad-hoc reporting. To view some industry use-case specifics, click here.
What is ad-hoc reporting?
Unlike a canned report that serves up data on the same metrics in the same format over a standardized period of time, ad-hoc reporting allows non-technical users to make specific queries and generate their own reports—without needing IT involvement.
For example, they might see in a quarterly sales report that revenue is higher than the previous three quarters. But whyis it higher? An ad-hoc report can help them ask specific questions to understand the ‘why’ and what that might mean for future sales. It allows them to visualize the data better so they can make better data-driven decisions.
Ad-hoc reporting and analysis can be used across enterprises and industries, from manufacturing to healthcare to financial services. An executive might want to know if their pricing is competitive. A sales team might want to identify which demographic groups are buying a particular product. And a customer support team might want to monitor recurring issues. With the right tools, they can find out the answers for themselves—when they need those answers.
Ad-hoc reporting benefits
In a nutshell, ad-hoc BI capabilities arm non-technical users with the data they need—in a format they understand—to make better business decisions. Here are some of the other benefits of ad-hoc reporting and analysis:
1. Save IT resources
2. Save money
3. Faster time to insight
4. Increase adoption
5. Increase productivity
6. Collaborate more effectively
7. Avoid decision fatigue
Save IT resources: Once the IT department sets up the ad-hoc reporting tool, their job is done. Users can create their own reports and get the results of their queries often in a matter of seconds. When considering BI platforms, look for ad-hoc reporting capabilities designed for non-technical users to minimize the need for training and ongoing support, as well as more granular controls for advanced users.
Save money: With ad-hoc reporting, IT staff no longer has to spend time responding to user queries and creating customized reports, nor is there a need to hire data analysts and scientists. This, in turn, can positively affect the company’s bottom line while allowing IT staff and data analysts to focus on more value-added activities. And embedding self-service BI within existing applications saves the time and expense of building BI features internally.
Faster time to insight: Rather than canned reports, ad-hoc analysis allows users to customize reports on the fly to answer specific business questions. This can help them make informed decisions in the moment, rather than relying on gut instinct or waiting days for the IT department to crunch the numbers and get back to them—when the moment might be lost.
Increase adoption: Ad-hoc tools that are built with non-technical users in mind offer intuitive dashboards and interfaces, drag-and-drop tools, and drop-down menus, which can simplify data analysis and drive user adoption. If it requires sending a request to the IT department, or if the self-service tool is too complicated, it will be much harder to drive adoption.
Increase productivity: Rather than staring at a spreadsheet and trying to make sense of the rows and rows of data, ad-hoc reporting allows users to interact with the data through features such as ad-hoc dashboards, rich visualizations, and drill-down capabilities. The more users can play around with the data, the more they can ask new questions and find new insights. This, in turn, can drive more engagement and increase productivity.
Collaborate more effectively: With the right tools, users can collaborate and share ad-hoc reports and dashboards—and their insights—with their teams and executive leadership. They can also build their own KPIs and dynamic report metrics in an embedded BI environment to increase team collaboration, helping to reduce data silos and create a single source of truth.
Avoid decision fatigue: Modern ad-hoc reporting tools allow users to design their own reports using a template, but IT can limit the number of KPIs in a single report to prevent users from becoming overwhelmed—which can lead to decision fatigue.
Ad-hoc reporting puts the power of data analysis into the hands of business users, helping them visualize data, glean meaningful insights and inform in-the-moment decisions. For example, Wyn’s easy-to-use designers allow non-technical users to create ad-hoc reports without the need for coding or IT assistance. Find out more about how ad-hoc reporting can be a game-changer for your organization here.


