A business intelligence (BI) dashboard embedded into an application offers several advantages. By seamlessly leveraging a tool like Wyn Enterprise Dashboards within your application, you can provide users with a powerful and customizable data visualization experience.
The dashboard integration lets you present relevant information and insights directly within the application’s interface, enhancing the user experience and streamlining decision-making. Users can access and interact with the dashboards in real time, gaining valuable insights without switching between multiple tools or applications.
Embedding a BI dashboard also saves significant development time and effort. Building a comprehensive and user-friendly dashboard from scratch can be complex and time-consuming. Utilizing a pre-built solution like Wyn Enterprise Dashboards allows you to leverage its extensive functionality and features without having to build it yourself.
This hands-on article demonstrates how to add an embedded BI dashboard into a web application built with React.
Prerequisites
To follow along with this tutorial, you need to:
- Download and install Wyn Enterprise on-premise for a 30-day evaluation
- Register with a business email account when requested
- Have basic knowledge of React
Note: You can install the Wyn Enterprise directly on Windows and Linux machines, but for macOS devices, you’ll need to use Docker to create a local installation.
Seamless BI Data Integration for Any Application
Integrating a dashboard into your web applications enables quick access to BI data. Traditional BI workflows often involve:
- Exporting data from various sources
- Transforming it
- Loading it into a separate BI platform for analysis
An embedded BI dashboard saves users these cumbersome steps, directly connecting to the relevant data sources to access real-time or near-real-time data.
Web Application
This hands-on tutorial uses a sample web application written in React. If you want to install and run the application to follow along with the article, download the project’s source code.

This financial web application helps users manage their finances.
While these menu items are all finance-related, each pulls information from a completely different data source, including APIs, third-party components, and cloud-based services. Moreover, the views displayed when the user clicks on each menu can also be different. Creating and maintaining all the data sources and generating all the customizable views is often labor-intensive, requiring many development hours.
Fortunately, your application can benefit from the embeddable technique — which embeds externally created, designed, and produced data and visualizations directly in your web application pages.
To demonstrate a seamless BI data integration, we’ll take an existing simple web application written in React and show how to embed a white-label dashboard.
Create a Dashboard
Here’s how to create a Wyn Enterprise dashboard to add to a web app.
First, open the Wyn Enterprise portal (localhost:51980) in your browser:
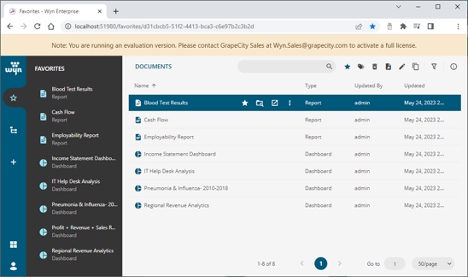
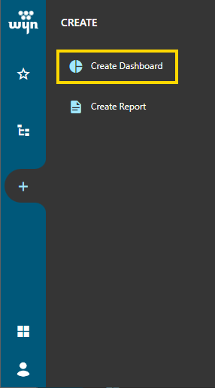
Click the plus sign (+) and choose Create Dashboard:

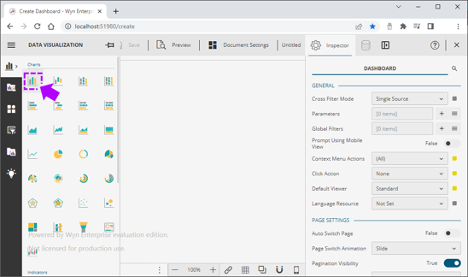
This opens the dashboard designer. Select the Charts menu and click Bar Chart:
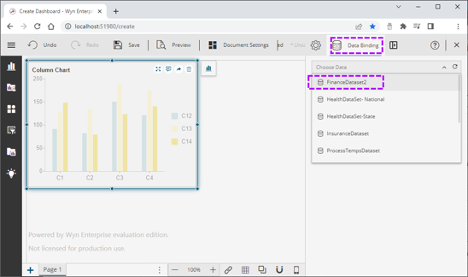
Select the newly created chart, click the Data Binding dropdown list, and choose FinanceDataset2 as the chart data source.
Next, you need to define the values for the bar chart. Drag the fields below to the Values property:
- Profit/loss for the period
- Revenue
- Sales, general and admin costs, and other operating items
Then drag the Year field and drop into the Axis (Category) property:
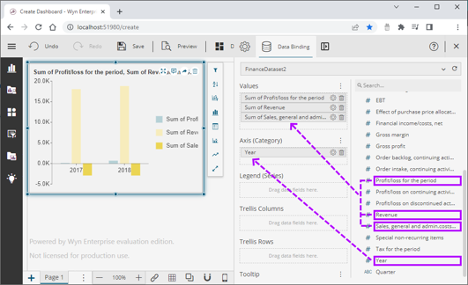
Finally, click Save, name the dashboard “Revenue Report YOY” under the Finance category, and click OK:

Customize the Dashboard
You can customize the dashboard to match your web application’s theme. Open the Wyn Enterprise portal, select the Inspector tab, and change the Palette field under Chart Style to closely match the palette of the host web application. You can also change many other properties, including title, tooltip, and axis.

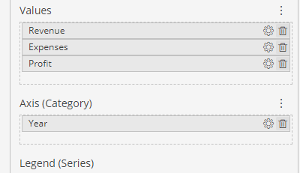
Now, click the gear icon (⚙️) to the right of each Value and choose the Rename… menu:

Then, modify the labels for the chart values as follows:
- Rename Sum Profit/loss for the period to Profit.
- Rename Sum of Revenue to Revenue.
- Rename Sum of Sales, general... to Expenses.
- Drag and drop the new names inside the Values list to re-order the items, like so:
- Revenue
- Expenses
- Profit
You can retrieve the iframe src attribute by clicking the Copy URL option available in the Document Portal of Wyn Enterprise.
Configuring the Environment Variables
Your React project needs a configuration file to manage environment-specific configurations and sensitive information for the web application. Let’s see how to set up this configuration file.
First, create your .env file at the root of the React project.
Next, find the new Revenue Report YOY dashboard and click the Copy URL option available in the Document Portal:
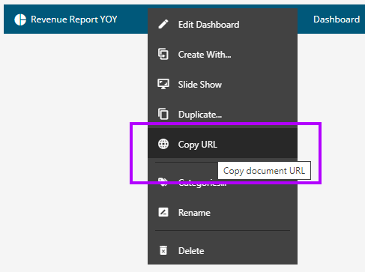
This gives you the dashboard URL in the following format:
http://localhost:51980/dashboards/view/<<YOUR-DASHBOARD-ID>>?theme=minimal-blue&lng=en-US
Next, access http://localhost:51980/management#client-management and copy the Client Secret value corresponding to the “integration” Client Id.
Now, add the following content to your .env file, replacing the Dashboard ID and the Client Secret with the information you have:
REACT_APP_PORTAL_URL=http://localhost:51980
REACT_APP_DASHBOARD_ID=<<YOUR-DASHBOARD-ID>>
REACT_APP_CLIENT_SECRET=<<YOUR-INTEGRATION-CLIENT_SECRET>>
Embedding the Dashboard
You can embed the Wyn Dashboard using one of several ways. This tutorial shows you how to embed it using iFrame, Div, and Dashboard Lite Viewer.
Getting the Access Token
Before embedding the Dashboard, you must provide a means to get the authentication token Wyn requires. You’ll use your sample React project’s sign-in component for this purpose. This component creates the UI where the admin can enter their Wyn Enterprise administrative credentials:

This form gets an authentication token from the local Wyn Enterprise Server, whose URL was configured earlier in the REACT_APP_PORTAL_URL environment variable. Using this authentication approach allows you to leverage Wyn’s advanced built-in security features, including role-based permissions, audit logs, and multi-tenancy.
Let’s see how this API call is implemented within the sign-in component:
const handleSubmit = async () => {

      var urlencoded = new URLSearchParams();

      urlencoded.append("grant_type", "password");

      urlencoded.append("username", username);

      urlencoded.append("password", password);

      urlencoded.append("client_id", "integration");

      urlencoded.append("client_secret", process.env.REACT_APP_CLIENT_SECRET);


      const response = await fetch(process.env.REACT_APP_PORTAL_URL + "/connect/token", {

            method: 'POST',

            headers: {

                  'Accept': 'application/json',

                  'Content-Type': 'application/x-www-form-urlencoded',

            },

            redirect: 'follow',

            body: urlencoded

      });


      await response.json().then(res => {

            var token = res.access_token;

if (token) {

                  setToken(token);

                  setErrorMessage("");

                  localStorage.setItem('WinEnterpriseToken', token);

            } else {

                  setErrorMessage("Authorization error");

                  setToken('');

            }

      }).catch(err => {

            console.log(err);

            setErrorMessage("Authorization error");

      });

}
The handleSubmit function above handles the form submission for the authorization process.
The URLSearchParams object is built with the username and password values entered in the form fields. Then, the fetch function executes a POST request to the local Wyn Enterprise Server’s /connect/token endpoint with the URLSearchParams payload.
The response is finally parsed as JSON, where the access_token property is extracted. The function then stores the user’s access token in the token variable and local storage to maintain the token as the users navigate the app.
Embedding the Dashboard with iFrame
Important: While iFrames offer versatility, exercise caution and implement security measures like sandboxing and source verification to prevent potential threats. Using iFrames introduces security considerations due to the risk of cross-site scripting (XSS) attacks, where malicious content or scripts can access or modify the parent page. You can employ iFrame sandboxing using the sandbox attribute to restrict the iFrame capabilities and isolate it from the rest of the page. It’s also crucial to load iframes only from trusted sources, regularly update embedded content, and verify the integrity of sources to ensure security.
This approach is the most straightforward. You can create an HTML iFrame element to embed Wyn Enterprise into your web application seamlessly.

Let’s implement the DashboardViaIFrame component:
const DashboardViaIFrame = ({portalUrl, dashboardId}) => {


  const iframeSrc = `${portalUrl}/dashboards/view/${dashboardId}`;


  return (

    <div className="dashboard-container">

      <iframe src={iframeSrc} height="600px" width="1000px"></iframe>

    </div>

  );

}
export default DashboardViaIFrame;
The DashboardViaIFrame renders an iFrame element that displays a dashboard within a container.
Here’s a breakdown of the component:
- DashboardViaIFrame is a functional React component defined as an arrow function. It accepts two props, portalUrl, and dashboardId.
- Inside the component, you define iframeSrc by concatenating the portalUrl and dashboardId props. It forms the source URL for the iFrame, which points to a specific dashboard.
- The portalUrl is the base URL of your Wyn portal. During the development phase, you host it locally at http://localhost:51980/.
To use this component, you provide the portalUrl and dashboardId props when rendering it:
<DashboardViaIFrame portalUrl={portalUrl} dashboardId={dashboardId} />
Embedding the Dashboard with Div Tags
You can also use the HTML Div element as an anchor to integrate the Wyn Dashboard into your web applications. This approach secures your application from cross-site attacks.
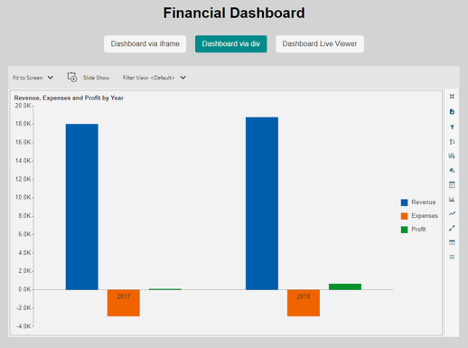
Use the following code to implement the DashboardViaDiv component:
import { WynIntegration } from "@grapecity/wyn-integration";


import React, { useEffect } from 'react';


const DashboardViaDiv = ({ portalUrl, dashboardId, token }) => {

  useEffect(() => {

      WynIntegration.createDashboardViewer({

        baseUrl: portalUrl,

        token: token,

        defaults: {

            dashboardId: dashboardId

        },

    }, '#wyn-root');

  });


  return <div className="dashboard-container">

            <div id="wyn-root" />

          </div>;

};


export default DashboardViaDiv;
The DashboardViaDiv React component uses the WynIntegration module to render a dashboard within a container. Here’s a breakdown of the component:
- The @grapecity/wyn-integration package imports the WynIntegration module. This module provides functionality to integrate and display dashboards.
- The DashboardViaDiv component takes three props: portalUrl, dashboardId, and token.
- Inside the component, the useEffect hook performs the initialization code. The effect runs once after the component mounts, calling WynIntegration.createDashboardViewer with an object specifying the dashboard viewer’s baseUrl, token, and defaults. You set the dashboardId prop as the value of the dashboardId property in the defaults object. The second argument, '#wyn-root', is a selector for the DOM element where the dashboard will render.
- The WynIntegration.createDashboardViewer function renders the Standard Dashboard Viewer.
- The wyn-root div element serves as the target container for the dashboard viewer.
To use this component, provide the portalUrl, dashboardId, and token props when rendering it:
<DashboardViaDiv portalUrl={portalUrl} dashboardId={dashboardId} token={token} />
Standard Dashboard Viewer, available within the Dashboard Designer tool, offers comprehensive data exploration capabilities that allow users to interact with dashboards, perform in-depth analysis, and gain enhanced data insights for intelligent decision-making. Its Preview toolbar includes features such as Fit to Screen, Slide Show, Refresh, and Export, letting users interact with and manipulate the dashboard during preview.
Due to its extensive features and data analysis capabilities, the Standard Viewer may impact the performance of dashboards, resulting in slower rendering or loading times, especially with complex or resource-intensive dashboards.
Meanwhile, the Lite Viewer is optimal for faster rendering and prioritizes dashboard viewability, especially on large screens. The Lite Viewer provides a rich API for customization and offers a comparatively simpler interface than the Standard Viewer.
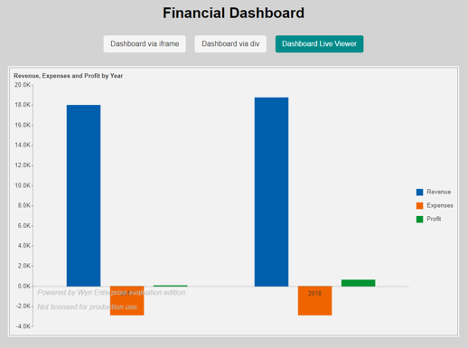
Here’s how to implement the Dashboard Lite Viewer in React:
Note that the code for the DashboardLite component is nearly identical to the DashboardViaDiv. The only difference is that in the DashboardViaDiv outlined in the section above, you used the WynIntegration.createDashboardViewerfunction to render the Standard Dashboard Viewer. Here, the DashboardLite component calls the WynIntegration.createViewerLite function to render the Dashboard Viewer Lite.
Here are some key features of the Dashboard Lite Viewer:
import { WynIntegration } from "@grapecity/wyn-integration";

import React, { useEffect } from 'react';

const DashboardLite = ({ portalUrl, dashboardId, token }) => {
  useEffect(() => {
      WynIntegration.createViewerLite({
        baseUrl: portalUrl,
        token: token,
        defaults: {
            dashboardId: dashboardId,
        },
    }, '#wyn-root');
  });

  return <div className="dashboard-container">
            <div id="wyn-root" />
          </div>;
};
export default DashboardLite;
Note that the code for the DashboardLite component is nearly identical to the DashboardViaDiv. The only difference is that in the DashboardViaDiv outlined in the section above, you used the WynIntegration.createDashboardViewerfunction to render the Standard Dashboard Viewer. Here, the DashboardLite component calls the WynIntegration.createViewerLite function to render the Dashboard Viewer Lite.
Here are some key features of the Dashboard Lite Viewer:
- Its optimized rendering speed prioritizes fast dashboard loading, making it suitable for scenarios where quick visualization is more important than detailed data exploration.
-
It boasts a rich API for tailored dashboard layouts and adding custom animations.
- It offers an optimized viewing experience, particularly on large screens.
Conclusion
Embedding a BI dashboard within an application provides a seamless and customizable data visualization experience, enabling swift access to BI data and enhancing decision-making capabilities.
You’ve seen how easy it is to customize and embed a BI dashboard from Wyn into your existing application. The ability to choose from three embedding approaches — iFrame, Div, and Dashboard Lite Viewer — helps you optimize the viewing experience across devices and app platforms.
Try Wyn for free today to connect and visualize your data and seamlessly bring Wyn Enterprise Dashboards to your web application.
Additionally, we created a sample on GitHub. This sample showcases the sample React application included in the Wyn Enterprise blog: How to Embed a White Label Dashboard into an Existing Web Application. It is a blank application that is meant to be fully built by following the steps in the blog.


