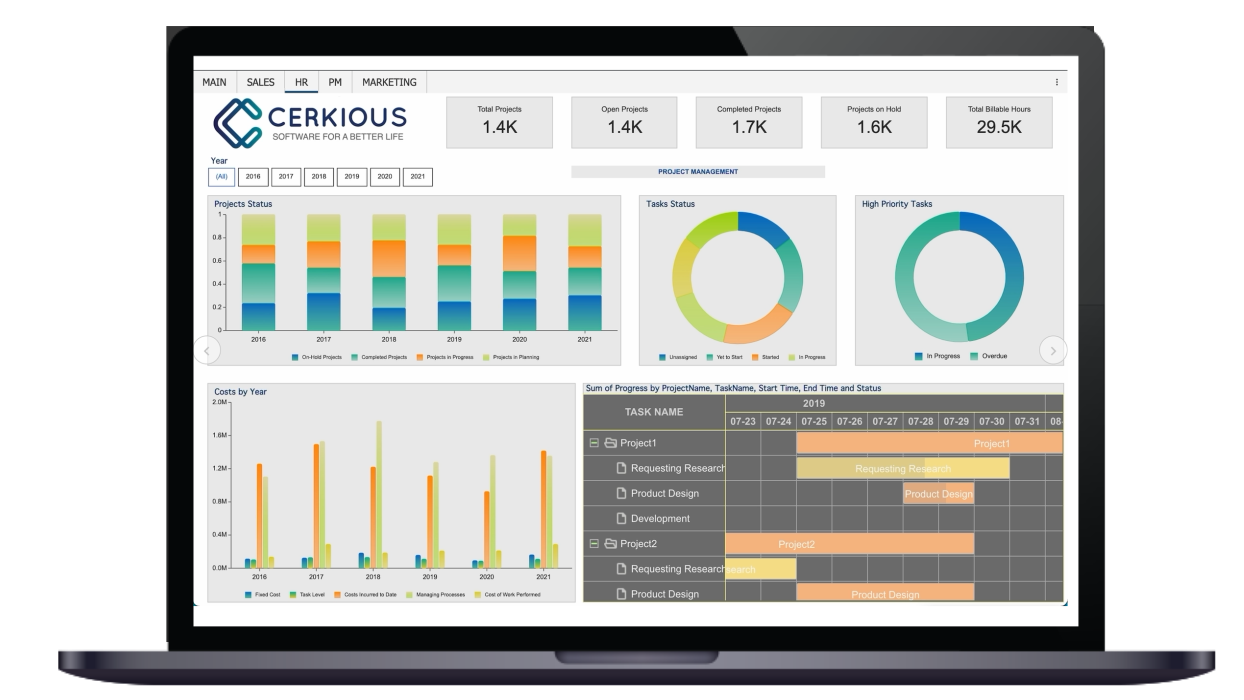
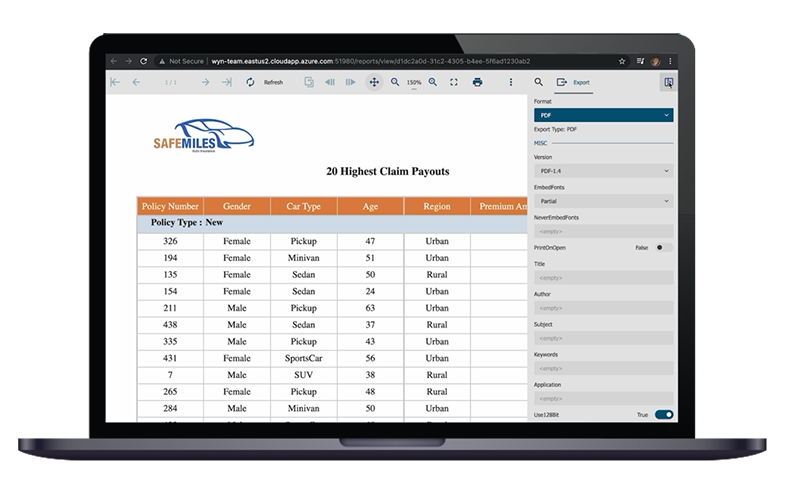
WynDashboards v6.0 is now available! The goal of this release is to further improve the analytic model capabilities and introduce new use case-based expressions while making WAX more available throughout the plugin. Wyn v6.0 also includes design-time functionality to help address the visualization needs of customers, new visualizations, and enhancements to existing visualizations based on customer requests.
Read the full Wyn v6.0 release post here.
Analytic Expressions for Dashboards
An analytical expression is a formula that uses a set of built-in functions, operators, and constants that empowers end-users to define ad-hoc calculations to arrive at newly processed information. With v6.0, Analytic Expressions can now:
-
Be used with Cached Datasets
-
Support RFM (Recency, Frequency, Monetary Value) Models and Value Analysis functions
-
Support Correlation Analysis Functions
-
Support Pareto Analysis Functions
-
Use Parameters, User Context, and Organization Context values
With these new analytic expression capabilities, specific use cases like RFM models allow for dashboards to be more functional for advanced analytic needs. Additionally, with expressions available at various levels of the dashboard design, this allows for the design to be more dynamic based on user usage and requirements.
Wyn Alerts - Data Monitoring Rules and Notifications
With Wyn Alerts, create threshold based notifications, based on Data Rules and Dashboard scenarios, that are always on to monitor data. Wyn Alerts allow for real-time monitoring and information sharing as a “push” action rather than requiring the user to open the dashboard and constantly watch a screen for KPI values. This helps to reduce time to insights, protect work time, and eliminated analysis fatigue.
Data Visualization Controls and Enhancements
KPIs as individual numbers is usually not enough as there is context and additional content about the KPI that goes along with the measure. The new Card Visualization allows for designing the KPI cards so the context and story behind the measure can also be shown along with the number. Other enhancements in this release allow for more control over the look and feel of the designed dashboard.
Enhancements include:
-
New Card Visualization Scenarios
-
Conditional formatting in RichText controls and other RichText Formatting options
-
Layout and design options for Tab strips containers and groups
-
Additional design properties for line chart scenarios
-
Support for Jump analysis in Funnels, KPI, Guage, and KPI Matrix
Dashboard Designer Enhancements -
Localization support in Dashboards allows authors to design content based on the user language. Authors can change the titles, labels and text explanations based on the user language to localize the design for end users.
Additionally, to further improve the embedded BI capabilities, new customization options for the designer allows developers to control the toolbox and inspector panel behavior as well as other actions and icons in the designer component.
Enhancements include:
-
Customizable Toolbox components and behavior
-
Internationalization support using Language Resources
-
Improved White-labeling (Hiding the “?” from the toolbar)
-
Customizable initialization state of Toolbox and Inspector panel
-
Multi-column sorting for Data Table scenarios
-
New Compact Layout for Pivot Tables
Data Filtering and Slicing Enhancements -
Based on customer feedback, the Date Slicer has been reworked to cater to many more use cases. Slicer values are now more controllable using parameters and can be used in expressions (WAX) to drive better visualization of data relationships and trends. Enhancements include:
-
Enhanced Date Slicer
-
Dynamic Slicers based on data in the scenario
-
Slicers for dynamic ranking and sorting in scenarios
-
Enhanced usage of parameters in setting slicer values
WynDashboards Developer API Enhancements -
The new API gives more programmatic control over the embedded viewer to drive user actions while the user is working within the host application. Enhancements include:
-
Add drill-down action events for Dashboard Viewer control.
-
Improved Performance on Designer and Viewer Requests
Additional customer requested features include -
-
Set Slicer value to “all” when everything is shown
-
Customize the “Empty Value” shown in dashboard scenarios
-
Support Left Click action for KPI Jump-to behaviors


