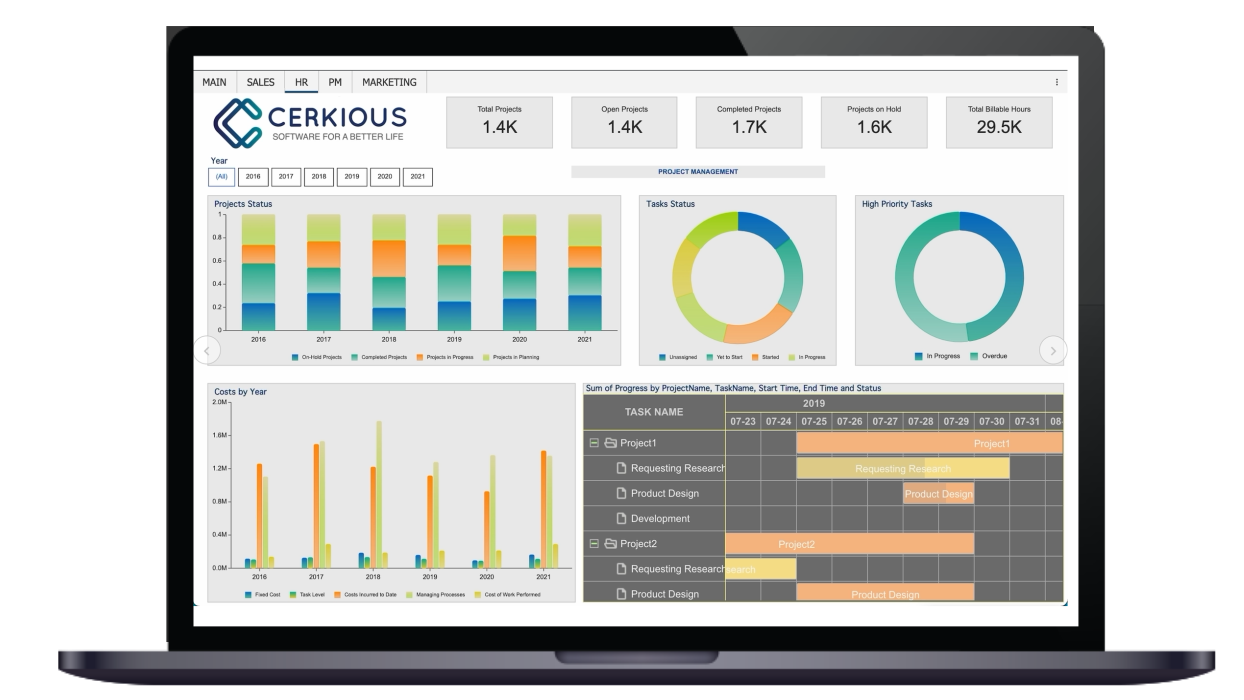
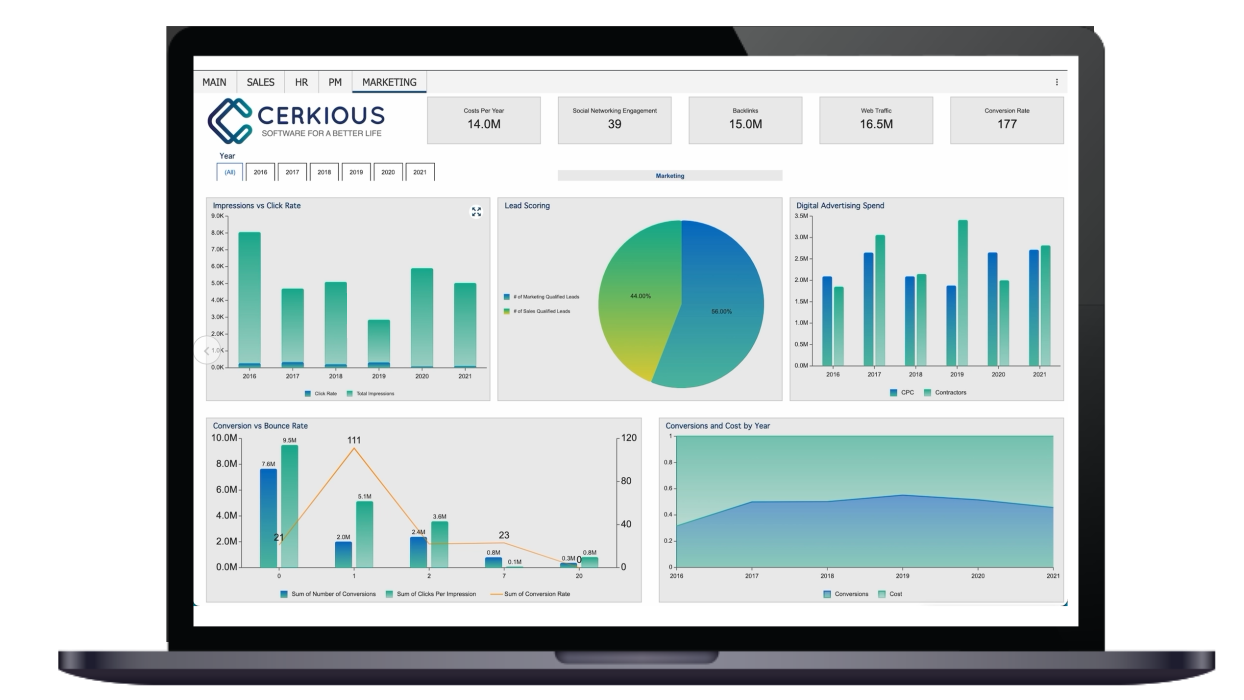
WynReports v6.0 release is now available. This release focuses on bringing some of the new features of AR16 to Wyn Enterprise. Also, this release introduces the capability to work with custom functions in Reports so that users can add proprietary business logic to be used in report design and rendering. Additional features include enhancements to the report viewer and designer interactivity.
Read the full Wyn v6.0 release post here.
Localization Support Using Language Resources:
Localizing content on reports is now possible with the new language resources. These resources allow authors to design content based on the user language. Authors can change titles, labels, and text explanations. Localization allows users to authentiacally tailor the reports to their language needs.
Custom Embedded Functions to Extend Expressions in Reports:
Users can now define custom functions for Report Authors to use when Designing Reports. Because every customer has proprietary business logic that may be required in reports, this can impact the rendering of the report. This impact can range from the masking of data for a certain set of users to business specific calculation of measures and dates in specific formats. These custom functions can now be added by admins for report authors to use in reports.
Enhancements to Report Viewer Capabilities:
Reports can sometimes have a large number of parameters and options for running. Setting these parameters everytime when the report is run can be a hassle and frustrating. The new saved filters functionality allows for end users to save the settings to be reused in subsequent report execution. This allows for easier and faster use of complex reports.
Enhancements include:
-
New “Saved Filters” capability for report parameters.
-
New Email options directly from the Report preview.
-
Exporting to Excel now preserves the Frozen columns and rows.
Enhancements to Report Design and Layout Capabilities:
Since reports are more commonly viewed on computers rather than being printed, interactivity on the screen is important. This release adds more controls for the tooptip and data labels controls along with enhanced conditional formatting for chart visualization in reports
Enhancements include:
-
Properties to define export filenames based on expressions.
-
Additional formatting options for tooltips in charts.
-
Added options to customize the data labels and tooltips in charts.
-
Reconfigured and introduced document metadata in the designer inspector panels.
Additional customer requested features:
-
Updated behavior of the “Select All” option in multi-select parameters.
-
Click and drag to resize the report page size in the report designer.
-
Compare different chart plots to define conditional formatting rules
-
The top Parameter panel size is now resizable.
-
Improvements in Excel Export capabilities and options.


