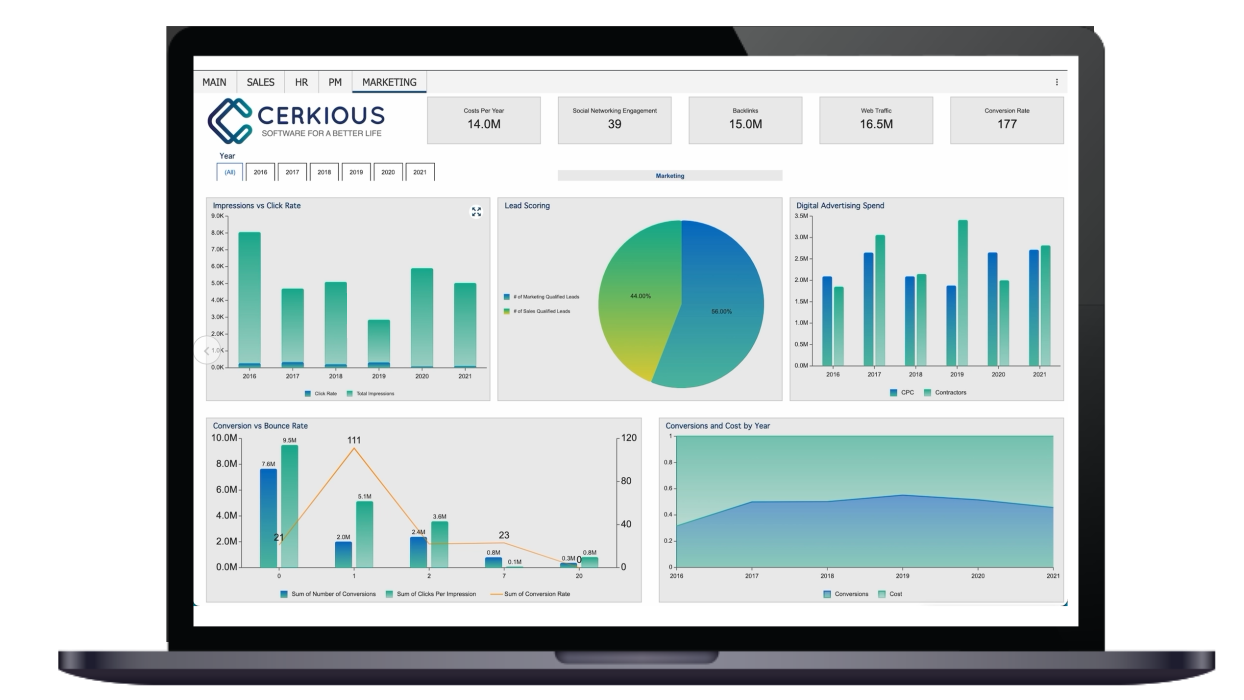
When an organization achieves Organizational Alignment, all employees are clear about the organization's purpose and goals and make decisions that align with them. With so many moving parts, (i.e. departments, vendors, suppliers, teams, contractors, interconnected business processes) it can be a struggle for modern companies to bring order to the chaos. It’s no surprise that Business intelligence (BI) platforms play a critical role in achieving organizational alignment.
BI is the process of collecting and interpreting valuable information regarding an organization's overall performance. An effective BI platform can be a framework to help an organization achieve alignment regardless of its size. The flow of data to EVERY member of an organization is key to successful organizational alignment and business intelligence (BI) strategy. Business decisions are not made exclusively by department heads; customer service, fulfillment, production, accounting, human resources, and sales designations all need easy access to data to support their daily business decisions.
At its core, BI allows for faster analysis of raw data identifying trends and outliers in both past and current performance. Being able to quickly know when a business process is “on track” or “out of whack” allows you to make data-driven decisions that provide benefits beyond efficiency and productivity, including:
· Better competitive advantage in the market
· Improved customer experience
· Improved employee satisfaction and lower turnover
This article will briefly discuss how companies can leverage BI to support organizational alignment.
The Basics of a Business Intelligence Platform
BI can generally be divided into data governance, analysis, and distribution. An effective BI platform should:
· Effectively govern the organization’s data
· Provide easy-to-use tools so business users can analyze their own data
· Be able to easily visualize trends and metrics
· Seamlessly distribute findings throughout all levels of the organization
BI platforms are typically tasked with pulling data from multiple sources within a company:
· Customer relationship management (CRM)
· Content management system (CMS)
· Vendor data, often from online portals
· Live customer data
· Marketing performance data
· Live feeds from market exchanges
An example of this is if you were to plot CMS statistics against visitor traffic from your website alongside new client signups from your CRM. This type of unique data comparison from multiple sources in real time may give you valuable insight into your sales funnel and the ability to identify trends that may impact your revenue stream and business cash flow.
Business Intelligence and Predictive Analytics
Business intelligence and predictive analytics are often discussed in the same circles, but they are different concepts. BI predominantly uses diagnostic analyses on historical data to visualize trends, while predictive analytics uses statistical algorithms and machine learning techniques in an attempt to predict future outcomes and results. A BI platform used in tandem with predictive analytics software can be a transformative step to achieving organizational alignment.
As a common example, data scientists and DB managers will often apply predictive analytics algorithms to their historical data and then use their BI platform to visualize and disseminate the conclusions throughout the organization.
It’s no surprise that the tech giant Samsung uses predictive analytics along with a BI platform to create interactive dashboards that allow them to deep-dive through an ocean of client data, consumer demographics, device profiles, and carrier loyalty scores to predict consumer upgrade preferences and make allocation decisions regarding their billion-dollar device manufacturing lines.
An interesting example of a smaller organization utilizing BI and Predictive Analytics is the Hamilton County Department of Education, one of the largest K-12 school systems in Tennessee, that leveraged BI and Predictive Analytics to analyze where they should invest their limited funds for best results. They collected data and applied predictive analytics to gain insights into how different types of teacher training could impact overall student performance. As a result, they allocated their budget toward training and programs that produced optimal results and achieved record-high graduation rates.
Using Business Intelligence to Drive Organizational Alignment
Use BI to Keep Score
Most professional sports have a large scoreboard and multiple stat tickers to keep the fans, players, managers, and officials apprised of the current status of the game. BI can bolster alignment initiatives by sharing key indicators in real time with all employees throughout an organization to keep everyone moving forward in unison.
Use BI to Focus the Team
Large datasets were not meant for human consumption. Organizations often use BI platforms as a part of their data governance strategy to provide relevant metrics to individual departments and individual roles within that department. Data that is relevant to one department may be useless and a distraction to other departments. Your company’s board of directors may only be interested in high-level aggregated data, so transactional data may be a nuisance to them. The shipping department doesn’t need to know sales and revenue KPIs for each salesperson, so the BI platform should only display shipping efficiency data and stats to members of the shipping department.
Use BI to Streamline Collaboration
Communication and collaboration are key to organizational alignment. An effective BI platform should provide a conduit for coworkers and colleagues to communicate ideas, results, and business issues in a format that is easily digested and understood.
Speed is critical too, so BI platforms with self-service capabilities are ideal. Self-service BI means that business users are able to easily create informative graphs, charts, and other visualizations from the data they are permitted to interact with. If every dashboard and report has to be created by an IT or data team member, then your BI will be bottlenecked by their department’s work schedule. Self-service BI platforms should liberate technically proficient developers and managers from having to provide dashboards and reports.
Select a BI Platform
Selecting the appropriate BI platform to assist with organizational alignment is not an easy task. BEFORE you approach business intelligence companies asking for price quotes, a good step is to first quantify the BI and business alignment goals of your organization.
Estimate the Total Number of Users
While there are a few BI platforms that license based on a flat-fee basis, that’s not the norm for the industry. Most BI and data analytics solutions are priced based on a “per-user” metric, so it’s helpful to have an estimate of what that will look like at various levels of scale and time. Keep in mind that many BI platforms consider anyone who “views” a report or visualization to be a “user,” so be aware of that before estimating the number of users. Your user base could expand into your customers and vendors depending on how your BI platform defines a “user.”
It’s also important to estimate the total number of users at various levels of scale and time. In this situation, it’s better to be hopeful and estimate more users than fewer. I suggest using the following benchmarks for comparison: Pre-launch development phase, launch day, launch + 6 months, launch + 1 year, launch + 2 years, and launch + 3 years.
Identify Who Will Need Access to BI and Analytics
The flow of data to EVERY member of an organization is key to a successful business intelligence (BI) strategy. Identify the stakeholders in every department that will need access to data and then develop “BI roles” within each department. An example of roles within a sales department would be:
Role 1: VP of Sales and Revenue – access to all sales data within an organization with drill-down capabilities to transactional data. Able to author and distribute dashboards and reports.
Role 2: Regional Sales Manager – access to all sales data within their region with drill-down capabilities to transactional data. Has access to aggregated data for the entire organization. Able to author and distribute dashboards and reports.
Role 3: Account Manager – access to sales data relevant to their accounts and clients. Has access to aggregated data for their region. Able to author dashboards and reports with a limited scope of distribution and export.
Ready to Leverage Self-Service BI to Power Your Business Alignment?
Wyn Enterprise by GrapeCity is a powerful, seamless self-service embedded BI platform that allows everyday users to become data-driven. Wyn guide and maximize the returns of your organizational alignment initiatives. See Wyn in action here.


